. 2011 Oct 11;108(41):17076-81.
doi: 10.1073/pnas.1114042108. Epub 2011 Oct 3.

Dosage-dependent phenotypes in models of 16p11.2 lesions found in autism

Affiliations

Dosage-dependent phenotypes in models of 16p11.2 lesions found in autism

Guy Horev et al. Proc Natl Acad Sci U S A. .

Abstract

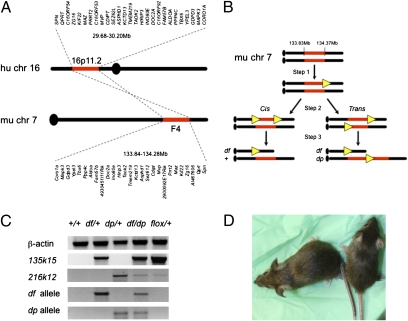
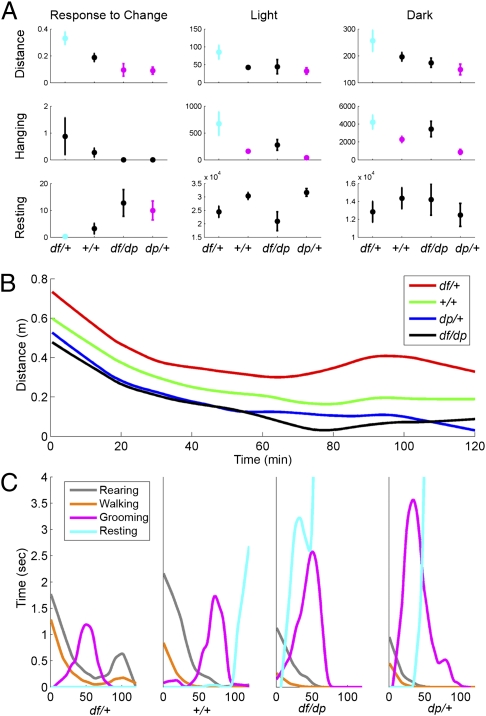
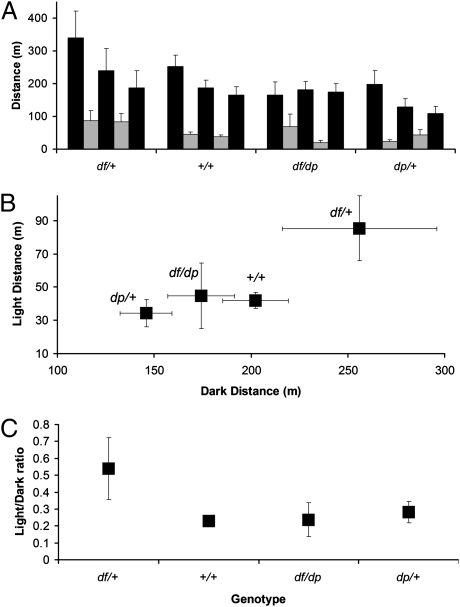
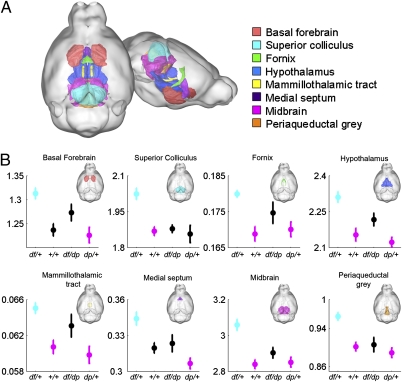
Recurrent copy number variations (CNVs) of human 16p11.2 have been associated with a variety of developmental/neurocognitive syndromes. In particular, deletion of 16p11.2 is found in patients with autism, developmental delay, and obesity. Patients with deletions or duplications have a wide range of clinical features, and siblings carrying the same deletion often have diverse symptoms. To study the consequence of 16p11.2 CNVs in a systematic manner, we used chromosome engineering to generate mice harboring deletion of the chromosomal region corresponding to 16p11.2, as well as mice harboring the reciprocal duplication. These 16p11.2 CNV models have dosage-dependent changes in gene expression, viability, brain architecture, and behavior. For each phenotype, the consequence of the deletion is more severe than that of the duplication. Of particular note is that half of the 16p11.2 deletion mice die postnatally; those that survive to adulthood are healthy and fertile, but have alterations in the hypothalamus and exhibit a "behavior trap" phenotype-a specific behavior characteristic of rodents with lateral hypothalamic and nigrostriatal lesions. These findings indicate that 16p11.2 CNVs cause brain and behavioral anomalies, providing insight into human neurodevelopmental disorders.


Conflict of interest statement

The authors declare no conflict of interest.

Figures

Fig. 1.
Fig. 1.
Generation of 16p11.2 models. (A) Genes mapping to human 16p11.2 CNVs are conserved in mouse. (B) Schematic of the chromosome engineering strategy used to generate mouse models of 16p11.2 CNVs. Step 1 is gene targeting at the 135k15 locus; step 2 is gene targeting at the 216k12 locus in the 135k15-targeted ES cells; and step 3 is Cre-mediated recombination. Cis and trans indicate that loxP sites (yellow triangles) had integrated on the same or different chromosome homologues, respectively. (C) Molecular validation. PCR products using primers specific for the positive control (β-actin), targeting at the first and second endpoints (135k15 and 216k12 loci, respectively), the df allele, and the dp allele are shown. (D) Before weaning, df/+ mice (Right) tend to be smaller than their +/+ siblings (Left; 8.8 and 15.4 g, respectively, for the females shown). Note the light-colored tail and ears of the df/+, which is a result of the presence of the Agouti transgene. In A and B, chromosome positions are shown in megabases. Further information is provided in Figs. S1 and S2, Dataset S1, and SI Experimental Procedures.
Fig. 2.
Fig. 2.
Multiple behaviors depend on 16p11.2 dosage. (A) The relationship between 16p11.2 dosage and distance traveled (Top), hanging (Middle), and resting (Bottom) is shown during the 2-h period immediately after cage transfer (Left), the light periods (Middle), and the dark periods (Right). Averages and standard error of the mean (SEM) are displayed. Statistically significant pair-wise differences relative to the df/+ group (determined by ANOVA followed by Tukey's confidence intervals) are depicted by the following: df/+ is cyan when it differs significantly from at least one other cohort, but is otherwise black; cohorts that differ significantly from df/+ are magenta, but are otherwise black. Dataset S3 shows pair-wise comparisons between genotypes. (B) Median distance traveled vs. time during the first 2 h after cage transfer. (C) Detailed behaviors during the first 2 h after cage transfer. Medians of the cumulative time of four distinct behaviors (rearing, walking, grooming, resting) vs. time elapsed from the beginning of the trial are shown for each genotype. During this period, df/+ mice do not rest; instead, they have a second peak of activity (B and C). Further information is provided in Dataset S3 and SI Experimental Procedures.
Fig. 3.
Fig. 3.
Behavior/diurnal rhythms are affected in 16p11.2 CNV mice. Comparison of the distance traveled in cohorts of distinct genotypes (detailed in the text) during 60 h of alternating 12-h dark and 12-h light cycles (i.e., spanning three dark periods plus two light periods). (A) The distance traveled over successive dark (black bars) and light (gray bars) periods is shown in bins of 12 h. Five successive dark or light periods are shown. (B) The average distance traveled during light vs. the average distance traveled during dark. (C) The ratio of light-to-dark activity indicates that df/+ mice are unusual in that their activity is not as restricted to the dark periods as the controls are. Average and SEM are presented in all panels.
Fig. 4.
Fig. 4.
MRI identifies structural changes in brains of 16p11.2 CNV mice. The relative volume (percentage of total brain volume) of eight brain regions is increased in df/+ mice. (A) Three-dimensional representation of the mouse brain highlights eight regions (colored as in legend) affected by 16.p11.2 dosage. (B) Relative volumes (shown as percentage of total brain volume) are dependent on dosage. Mean and SEM are shown. Statistically significant pairwise differences to the df/+ group (determined by t test followed by Bonferroni–Holm procedure) are depicted as follows: cyan indicates that df/+ differs from at least one other cohort, magenta indicates cohorts that differ significantly from df/+, and black indicates groups that do not differ significantly from df/+. Full pair-wise comparisons are shown in Dataset S4.
Fig. 5.
Fig. 5.
Details of alterations in the hypothalamus detected by MRI. Three-dimensional models of the surface of the hypothalamus (Bottom), coronal images showing the regions affected (Middle), and magnification focusing on the hypothalamus (Top). Red indicates voxels that differ significantly between df/+ and dp/+ cohorts with an FDR of 0.05. The sections performed along four locations marked A–D (A, most posterior; D, most anterior). Colors indicate voxels that differ significantly between df/+ and dp/+ cohorts, with brightness indicating the significance of the difference, as specified by the FDR. AHN, anterior hypothalamic nucleus; DMH, dorsomedial hypothalamus; FX, columns of the fornix; LHA, lateral hypothalamic area; MTT, mammillothalamic tract; OPT, optic tract; PH, posterior hypothalamic nucleus; ZI, zona incerta.

References

    1. Sebat J, et al. Strong association of de novo copy number mutations with autism. Science. 2007;316:445–449. - PMC - PubMed
    1. Liu H, et al. Genetic variation at the 22q11 PRODH2/DGCR6 locus presents an unusual pattern and increases susceptibility to schizophrenia. Proc Natl Acad Sci USA. 2002;99:3717–3722. - PMC - PubMed
    1. Stefansson H, et al. GROUP Large recurrent microdeletions associated with schizophrenia. Nature. 2008;455:232–236. - PMC - PubMed
    1. Stone JL, et al. International Schizophrenia Consortium Rare chromosomal deletions and duplications increase risk of schizophrenia. Nature. 2008;455:237–241. - PMC - PubMed
    1. Moeschler JB. Medical genetics diagnostic evaluation of the child with global developmental delay or intellectual disability. Curr Opin Neurol. 2008;21:117–122. - PubMed

Publication types

MeSH terms

Associated data