Clinical Trial
. 2011 Oct 11;108(41):17141-6.
doi: 10.1073/pnas.1104409108. Epub 2011 Oct 3.

Transcriptional modulator H2A histone family, member Y (H2AFY) marks Huntington disease activity in man and mouse

Affiliations
Clinical Trial

Transcriptional modulator H2A histone family, member Y (H2AFY) marks Huntington disease activity in man and mouse

Yi Hu et al. Proc Natl Acad Sci U S A. .

Abstract

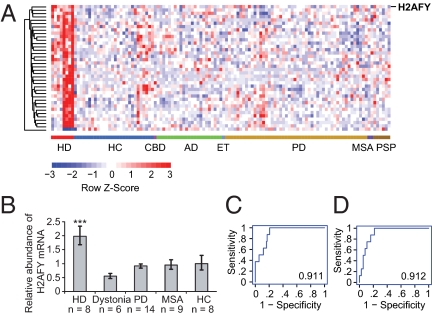
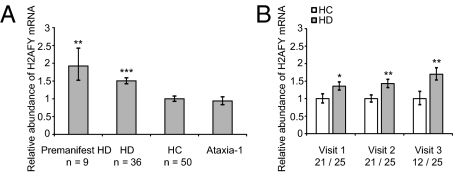
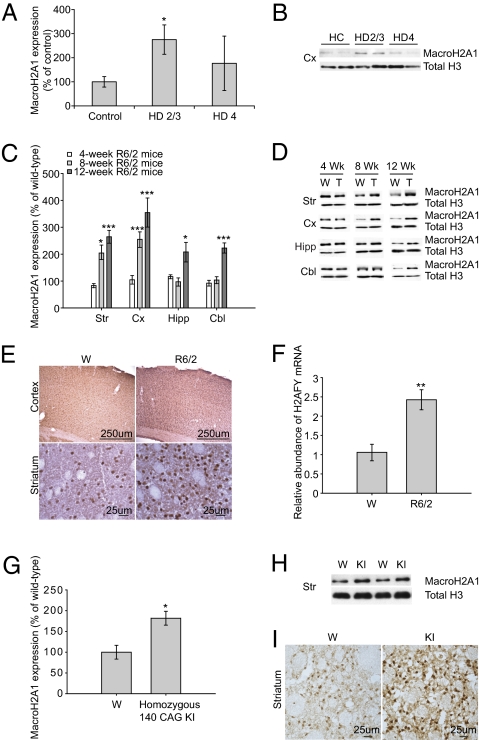
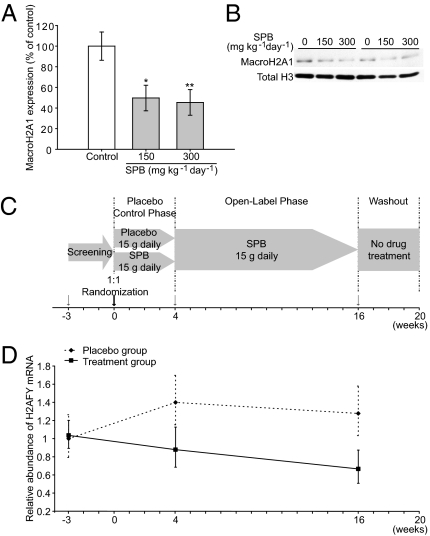
Huntington disease (HD) is a progressive neurodegenerative disease that affects 30,000 individuals in North America. Treatments that slow its relentless course are not yet available, and biomarkers that can reliably measure disease activity and therapeutic response are urgently needed to facilitate their development. Here, we interrogated 119 human blood samples for transcripts associated with HD. We found that the dynamic regulator of chromatin plasticity H2A histone family, member Y (H2AFY) is specifically overexpressed in the blood and frontal cortex of patients with HD compared with controls. This association precedes the onset of clinical symptoms, was confirmed in two mouse models, and was independently replicated in cross-sectional and longitudinal clinical studies comprising 142 participants. A histone deacetylase inhibitor that suppresses neurodegeneration in animal models reduces H2AFY levels in a randomized phase II clinical trial. This study identifies the chromatin regulator H2AFY as a potential biomarker associated with disease activity and pharmacodynamic response that may become useful for enabling disease-modifying therapeutics for HD.


Conflict of interest statement

Conflict of interest statement: C.R.S. has served as a consultant to Link Medicine Corporation and was a scientific collaborator of DiaGenic in a study funded by the Michael J. Fox Foundation. He is listed as coinventor on US patent/applications held by the Brigham and Women's Hospital relating to diagnostics in neurodegenerative diseases. S.M.H. is a scientific collaborator with the Novartis Institutes for Biomedical Research. He is listed as coinventor on US patent/applications held by the Massachusetts General Hospital relating to therapeutics and diagnostics in neurodegenerative diseases.

Figures

Fig. 1.
Fig. 1.
H2AFY is overexpressed in cellular blood of patients with HD in a discovery study comprising 119 individuals. (A) Genome-wide expression data of eight patients with HD and 111 controls, including 83 neurodegenerative disease controls, were analyzed. Expression levels for 38 genes most differentially expressed in patients with HD, including the transcriptional modulator H2AFY, are visualized (a complete list of all 99 genes significantly associated with HD is provided in Table S1). H2AFY is 1.6-fold overexpressed in cellular blood of patients with HD, with a FDR <0.00002 and P = 1.3 × 10⁻⁷ by two-sided t test. In the heat map, columns represent study subjects and rows represent genes. Expression higher than the mean is displayed as shades of red, and expression lower than the mean is displayed as shades of blue. AD, Alzheimer's disease; CBD, corticobasal degeneration; ET, essential tremor; PSP, progressive supranuclear palsy. (B) Overexpression of H2AFY in cellular blood of patients with HD was confirmed on the qPCR platform. H2AFY mRNA level are approximately twofold higher in blood of patients with HD [n = 8; mean age (y) ± SD: 51.8 ± 6.2] compared with that of HCs (n = 8; 50.9 ± 15.4; ***P = 0.0006) as well as patients with a hyperkinetic movement disorder other than HD (dystonia: n = 6; 56.3 ± 5.5; P < 0.0001) and patients with neurodegenerative movement disorders (PD: n = 14; 55.8 ± 4.8; P = 0.0004) or MSA (n = 9; 59.5 ± 6.8; P = 0.02). Error bars show SEM. The association between relative H2AFY mRNA abundance and HD is sensitive and specific with AUCs of 0.911 and 0.912 with accuracies of 96% and 87% at optimal cutoffs on the Affymetrix U133A (C) and qPCR (D) platforms, respectively.
Fig. 2.
Fig. 2.
Association between relative H2AFY mRNA abundance and HD is independently replicated in two validation studies. (A) Statistically significantly elevated H2AFY mRNA levels are observed in blood of individuals with manifest HD [n = 36; mean age (y) ± SD: 49.4 ± 13.1 y] as well as premanifest HD (n = 9; 48.1 ± 7.5) compared with HCs (n = 50; 49.5 ± 8.2) with fold changes of 1.5, with P = 0.0004 (***) and 1.9 with P = 0.002 (**), respectively. No difference in H2AFY mRNA abundance is observed between HCs and two samples from a subject with spinocerebellar ataxia-1. (B) In a second, longitudinal study of 25 patients with HD and 21 tightly age- and sex-matched controls followed over 2–3 y, H2AFY is overexpressed in the HD group relative to controls at the baseline visit (1.4-fold; *P = 0.02) and remains overexpressed at the second (1.4-fold; **P = 0.005) and third (1.7-fold; **P = 0.008) annual visits. Numbers of HCs and patients with HD assayed at each visit are shown on the x axis (number of HCs/number of patients with HD). Error bars in A and B show SEM.
Fig. 3.
Fig. 3.
Expression of histone protein macroH2A1 is increased in the brains of patients with early-grade HD as well as in R6/2 and knock-in mouse models. (A and B) Western blots show levels of macroH2A1 in histone extracts from the frontal cortex (Cx) of patients with HD and controls. MacroH2A1 expression is increased in HD grade 2/3 frontal cortex (*P = 0.05). A representative Western blot of frontal cortex from two controls, two individuals with early-grade, and two individuals with advanced HD is shown. The level of macroH2A1 is normalized to total histone H3 level. (C and D) Western blots show levels of macroH2A1 in histone extracts from the striatum (Str), cortex (Cx), hippocampus (Hipp) and cerebellum (Cbl) of mice. Representative Western blots comparing wild-type (W) and transgenic R6/2 (T) mice at 4, 8, and 12 weeks of age, respectively, are shown. At 4 wk, there is no significant difference in macroH2A1 levels in any of the brain regions. Levels of macroH2A1 are significantly increased in the striatum and cortex at 8 and 12 wk of age (n = 8). The level of macroH2A1 is normalized to the total histone H3 level. Striatum, *P = 0.02 (8 wk), ***P < 0.0001 (12 wk); cortex, ***P = 0.0001 (8 wk), ***P = 0.001 (12 wk); hippocampus, *P = 0.03 (12 wk); cerebellum, ***P < 0.0001 (12 wk). (E) Immunohistochemical staining for macroH2A1 is markedly increased in the cortex and striatum of R6/2 mice compared with wild-type mice. (F) qPCR confirmed an increase in relative H2AFY mRNA abundance in the cortex of R6/2 mice compared with wild-type mice, with P = 0.004 (**). Error bars in A, C, and F show SEM. (G and H) Western blots show levels of macroH2A1 in histone extracts from the striatum (Str) of 12-mo-old wild-type and homozygous 140-CAG knock-in mice. A representative Western blot is shown. Levels of macroH2A1 are increased in the striatum of knock-in mice (n = 4). MacroH2A1 is normalized to the total histone H3 level. *P = 0.014. KI, knock-in; W, wild type. (I) Immunostaining for macroH2A1 is also increased in the striatum of homozygous 140-CAG knock-in mice compared with wild-type mice.
Fig. 4.
Fig. 4.
H2AFY levels mark the pharmacodynamic response to treatment with the HDAC inhibitor SPB, a drug known to suppress huntingtin-induced neurodegeneration in mice. (A and B) R6/2 8-wk-old mice were treated with 150 or 300 mg⋅kg−1⋅d−1 of SPB for 2 wk, and macroH2A1 levels were determined in striatal histone extracts by semiquantitative Western blotting. R6/2 mice treated with 150 or 300 mg⋅kg−1⋅d−1 of SPB show a marked reduction in macroH2A1 levels compared with PBS-treated control mice with P = 0.02 (*) and P = 0.01 (**), respectively. (C and D) H2AFY levels in blood of patients with HD enrolled in a randomized, double-blind, placebo-controlled, phase II clinical trial (Phenylbutyrate Development for Huntington's Disease study). The relative abundance of H2AFY mRNA in SPB-treated and placebo groups was examined at baseline (week −3/visit 1), the end of the placebo-control phase (week 4/visit 4), and the end of the open-label phase (week 16/visit 7) as indicated by arrows. H2AFY expression is significantly down-regulated over time with SPB treatment. Error bars in A and D show SEM. By contrast, time alone (weeks) in the study (adjusting for drug treatment) is associated with a trend toward increasing H2AFY abundance [note subtle increase in H2AFY mRNA abundance in patients with HD (dotted line from week −3 to week 4) treated with placebo only].

Comment in

References

    1. Sugars KL, Rubinsztein DC. Transcriptional abnormalities in Huntington disease. Trends Genet. 2003;19:233–238. - PubMed
    1. van der Burg JMM, Björkqvist M, Brundin P. Beyond the brain: Widespread pathology in Huntington's disease. Lancet Neurol. 2009;8:765–774. - PubMed
    1. Panov AV, et al. Early mitochondrial calcium defects in Huntington's disease are a direct effect of polyglutamines. Nat Neurosci. 2002;5:731–736. - PubMed
    1. Maglione V, et al. The platelet maximum number of A2A-receptor binding sites (Bmax) linearly correlates with age at onset and CAG repeat expansion in Huntington's disease patients with predominant chorea. Neurosci Lett. 2006;393:27–30. - PubMed
    1. Stoy N, et al. Tryptophan metabolism and oxidative stress in patients with Huntington's disease. J Neurochem. 2005;93:611–623. - PubMed

Publication types

MeSH terms

Associated data