. 2011 Oct 18;108(42):17296-301.
doi: 10.1073/pnas.1104268108. Epub 2011 Oct 3.

The causality analysis of climate change and large-scale human crisis

Affiliations

The causality analysis of climate change and large-scale human crisis

David D Zhang et al. Proc Natl Acad Sci U S A. .

Abstract

Recent studies have shown strong temporal correlations between past climate changes and societal crises. However, the specific causal mechanisms underlying this relation have not been addressed. We explored quantitative responses of 14 fine-grained agro-ecological, socioeconomic, and demographic variables to climate fluctuations from A.D. 1500-1800 in Europe. Results show that cooling from A.D. 1560-1660 caused successive agro-ecological, socioeconomic, and demographic catastrophes, leading to the General Crisis of the Seventeenth Century. We identified a set of causal linkages between climate change and human crisis. Using temperature data and climate-driven economic variables, we simulated the alternation of defined "golden" and "dark" ages in Europe and the Northern Hemisphere during the past millennium. Our findings indicate that climate change was the ultimate cause, and climate-driven economic downturn was the direct cause, of large-scale human crises in preindustrial Europe and the Northern Hemisphere.


Conflict of interest statement

The authors declare no conflict of interest.

Figures

Fig. 1.
Fig. 1.
Responses of different variables in human society to climate change in Europe, A.D. 1500–1800. (A) NH temperature anomaly (°C, red line) and Europe temperature anomaly (σ, black line). (B) Ratio of grain yield to seed (red line) and NH extratropical tree-ring widths (black line). (C) Detrended grain price (Ag/L, red line) and detrended agricultural production index (black line). (D) Detrended wage index (σ, red line) and number of famine years per decade (black line). (E) Number of wars (red line) and magnitude of social disturbances (black line). (F) Detrended human height (in cm, red line) and number of plagues per decade (black line). (G) War fatality index (red line) and number of migrations per quarter century (black line). (H) Detrended population size (in millions, red line) and population growth rate (%, black line). All data are smoothed by 40-y Butterworth low-pass filter. The blue shading represents the crisis period (Cold Phase), and the blue dashed line represents short-term cooling.
Fig. 2.
Fig. 2.
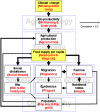
Set of causal linkages from climate change to large-scale human crisis in preindustrial Europe. The terms in bold black type are sectors, and terms in red type within parentheses are variables that represent the sector. The thickness of the arrow indicates the degree of average correlation, which is calculated from SI Appendix, Table S2.
Fig. 3.
Fig. 3.
Real grain prices and the alternation of periods of harmony and crisis in Europe, A.D. 1200–1800. (A) European temperature anomaly (σ, orange line), real grain price (Ag/L, bold black line), and the threshold of general crisis (real grain price = 0.2, pink dotted line). (B) Agricultural production index (orange line) and population size (in millions, green line). European temperature, real grain prices, and agricultural production index were smoothed by 40-y Butterworth low-pass filter. The light gray stripe represents a period of general crisis (real grain price >0.2); the dark gray stripe represents a period of demographic collapse.
Fig. 4.
Fig. 4.
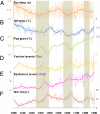
Temperature change and the alternation of periods of harmony and crisis in the NH during the past millennium. (A) European temperature anomaly (σ). (B) NH temperature anomaly (°C). (C) NH annual population growth rate (%). (D) Famine years in the NH (number of famine years per decade). (E) Number of deadly epidemic events (malaria, plague, typhus, measles, smallpox, and dysentery) per decade in the NH. (F) Number of wars per year in the NH. All data were smoothed by a 100-y Butterworth low-pass filter. Gray stripes represent periods of crisis in Europe as delimitated by historians (SI Appendix, Text section 4.2).

References

    1. Atwell WS. Volcanism and short-term climatic change in East Asian and world history, c. 1200-1699. J World Hist. 2001;12:29–98.
    1. Atwell WS. Time, money, and the weather: Ming China and the 'great depression' of the mid-fifteenth century. J Asian Stud. 2002;61:83–113.
    1. deMenocal PB. Cultural responses to climate change during the late Holocene. Science. 2001;292:667–673. - PubMed
    1. Weiss H, Bradley RS. Archaeology. What drives societal collapse? Science. 2001;291:609–610. - PubMed
    1. Bryson RA, Murray TJ. Climates of Hunger: Mankind and the World's Changing Weather. Madison, WI: Univ of Wisconsin Press; 1977.

Publication types

MeSH terms