. 2011 Oct 11;108(41):17016-21.
doi: 10.1073/pnas.1112169108. Epub 2011 Oct 3.

CCAAT/enhancer binding protein alpha (C/EBP(alpha))-induced transdifferentiation of pre-B cells into macrophages involves no overt retrodifferentiation

Affiliations

CCAAT/enhancer binding protein alpha (C/EBP(alpha))-induced transdifferentiation of pre-B cells into macrophages involves no overt retrodifferentiation

Alessandro Di Tullio et al. Proc Natl Acad Sci U S A. .

Erratum in

  • Proc Natl Acad Sci U S A. 2012 Jul 3;109(27):11053
  • Proc Natl Acad Sci U S A. 2012. doi: 10.1073/pnas.1208762109. Castellano, Giancarlo [added]

Abstract

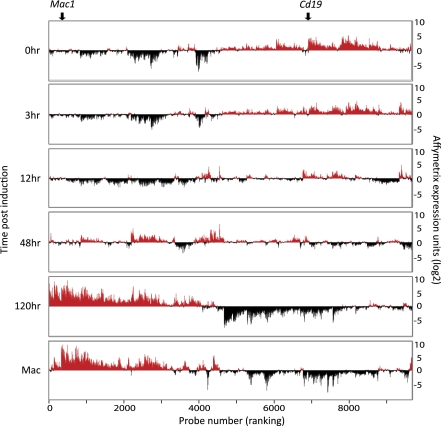
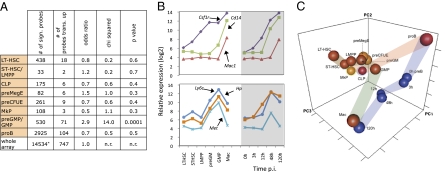
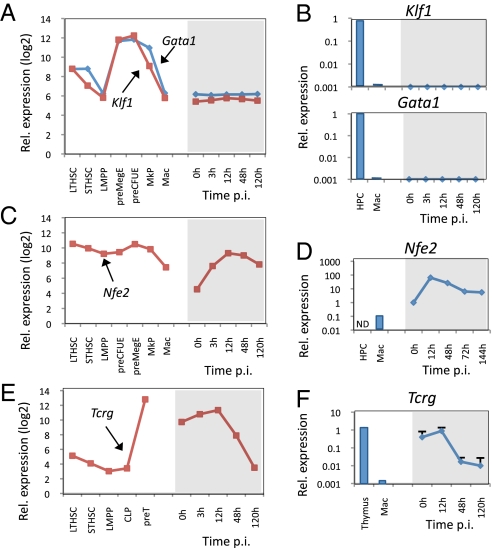
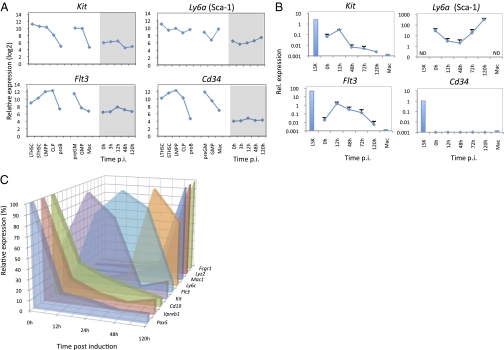
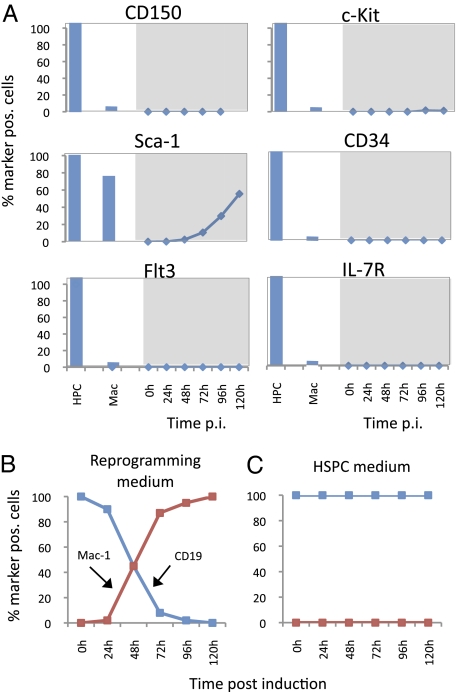
Earlier work has shown that pre-B cells can be converted into macrophages by the transcription factor CCAAT/enhancer binding protein α at very high frequencies. Using this system, we performed a systematic analysis of whether during transdifferentiation the cells transiently reactivate progenitor-restricted genes or even retrodifferentiate. A transcriptome analysis of transdifferentiating cells showed that most genes are up- or down-regulated continuously, acquiring a macrophage phenotype within 5 d. In addition, we observed the transient reactivation of a subset of immature myeloid markers, as well as low levels of the progenitor markers Kit and FMS-like tyrosine kinase 3 and a few lineage-inappropriate genes. Importantly, however, we were unable to observe the reexpression of cell-surface marker combinations that characterize hematopoietic stem and progenitor cells, including c-Kit and FMS-like tyrosine kinase 3, even when CAAT/enhancer binding protein α was activated in pre-B cells under culture conditions that favor growth of hematopoietic stem and progenitor cells or when the transcription factor was activated in a time-limited fashion. Together, our findings are consistent with the notion that the conversion from pre-B cells to macrophages is mostly direct and does not involve overt retrodifferentiation.


Conflict of interest statement

The authors declare no conflict of interest.

Figures

Fig 1.
Fig 1.
Gene-expression profiles of cells during C/EBPα-induced reprogramming. Unsupervised hierarchical clustering of Affymetrix gene-expression array data of pre-B cells induced for the times indicated. All probes that showed a greater than twofold change in expression at any time during the experiment were included. Negative peaks in black represent probes expressed below the median value; positive peaks in red represent probes expressed above the median value. Affymetrix expression values are indicated in a log2 scale. Positions corresponding to the expression of Mac1 and Cd19 genes are shown above the profiles.
Fig. 2.
Fig. 2.
Comparative analysis of the transcriptome of transdifferentiating cells with that of normal progenitors reveals enrichment of myeloid progenitor genes. (A) Enrichment of cell stage-specific signatures in transdifferentiating cells. Signature genes were defined as genes more highly expressed in a given cell stage than in all other stages, compiled from 14,534 probesets with a greater than twofold change in expression across all differentiation stages. The table shows the number of signature genes that are transiently up-regulated by more than twofold during reprogramming; the P value indicates the significance of enrichment. (B) Gene-expression values (Affymetrix arrays) of three preGMP/GMP signature genes (Upper) and three macrophage signature genes (Lower) in comparison with transdifferentiating cells. Mac, cultured bone marrow-derived macrophages. (C) Principal component analysis of gene probes that show greater than twofold changes across all samples. Normal lymphoid-myeloid progenitors and differentiated progeny (pro-B cells and macrophages) are shown as red balls, megakaryocyte/erythroid progenitors are shown in orange, and transdifferentiating cells are shown in blue. The ribbons indicate the pathways leading to myeloid differentiation (green), to the B-cell lineage (red), and to transdifferentiation as well as the transition from pro-B to pre-B cells in culture (blue).
Fig. 3.
Fig. 3.
Megakaryocyte and T-cell–associated gene expression during transdifferentiation. Comparison of lineage-associated gene expression (Affymetrix arrays and qRT-PCR) in different progenitors/macrophages and transdifferentiating cells. (A and B) Relative expression of the erythroid transcription factor genes Klf1 and Gata1. Hematopoietic progenitors (HPC7 cell line) and macrophages (Mac) were used as controls (blue bars). (C and D) Relative expression of the megakaryocytic transcription factor gene Nfe2. Macrophages (Mac) were used as control. (E and F) Relative expression of the T-cell–associated gene Tcrg. The pre-T (DN3) T-cell line FA2C1 and whole thymus were used as positive controls. Mac, cultured bone marrow-derived macrophages.
Fig. 4.
Fig. 4.
Progenitor-restricted gene expression during C/EBPα-induced reprogramming. (A) Comparison of Affymetrix gene-expression values in different progenitors and in cells during reprogramming (gene names are shown above the line graphs). (B) qRT-PCR expression values of progenitor genes in cells during reprogramming. Values represent average plus SD of samples from three independent experiments. Positive controls are Lin/Sca1+/Kit+ progenitors (LSK) and cultured bone marrow-derived macrophages (Mac), indicated by blue bars. (C) Timing of specific genes during reprogramming as determined by Nanostring technology. The highest values obtained in the different time points for each gene (Pax5, CD19, and Vpreb1 at 0 h: 2,046, 10,544, and 37,932, respectively; Kit at 12 h: 156; Flt3 at 24 h: 226; Ly6c at 48 h: 51,786; Mac1, Lyz2, and Fcgr1 at 120 h: 4,787, 36,563, and 23,221, respectively) were normalized to 100%.
Fig. 5.
Fig. 5.
Progenitor-restricted cell-surface antigen expression during C/EBPα-induced reprogramming. (A) Expression of progenitor cell-surface markers in cells induced with β-Est for various times. Positive controls are as in Fig. 3. (B) Kinetics of differentiation-marker expression of C/EBPαER-infected pre-B cells induced with β-Est under myeloid/B-cell culture conditions. (C) As in B, but induced cells were grown under hematopoietic culture conditions.

References

    1. Yamanaka S. Elite and stochastic models for induced pluripotent stem cell generation. Nature. 2009;460:49–52. - PubMed
    1. Graf T, Enver T. Forcing cells to change lineages. Nature. 2009;462:587–594. - PubMed
    1. Vierbuchen T, et al. Direct conversion of fibroblasts to functional neurons by defined factors. Nature. 2010;463:1035–1041. - PMC - PubMed
    1. Huang P, et al. Induction of functional hepatocyte-like cells from mouse fibroblasts by defined factors. Nature. 2011;475:386–389. - PubMed
    1. Zhou Q, Melton DA. Extreme makeover: Converting one cell into another. Cell Stem Cell. 2008;3:382–388. - PubMed

Publication types

MeSH terms

Substances

Associated data