. 2011 Dec;31(24):4938-50.
doi: 10.1128/MCB.06120-11. Epub 2011 Oct 3.

Tyrosine phosphorylation of lactate dehydrogenase A is important for NADH/NAD(+) redox homeostasis in cancer cells

Affiliations

Tyrosine phosphorylation of lactate dehydrogenase A is important for NADH/NAD(+) redox homeostasis in cancer cells

Jun Fan et al. Mol Cell Biol. 2011 Dec.

Abstract

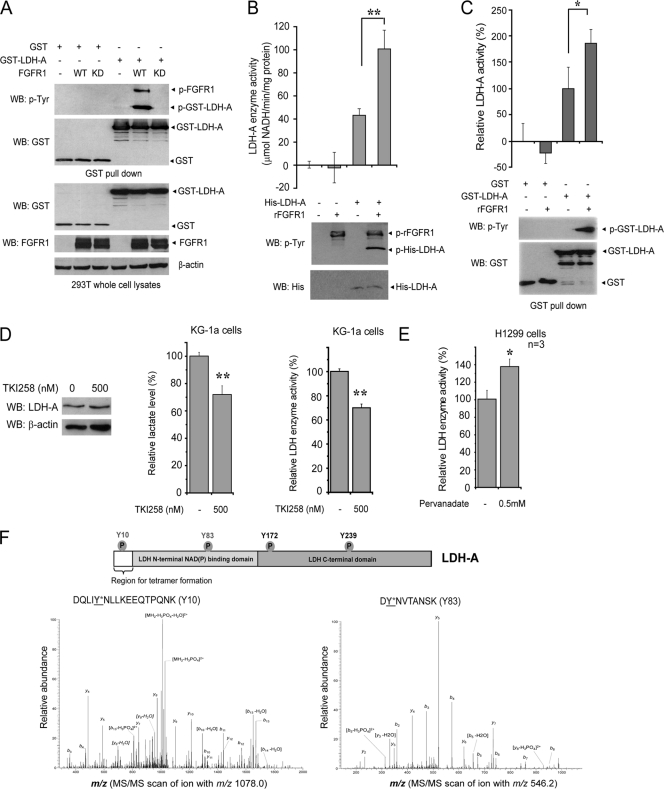
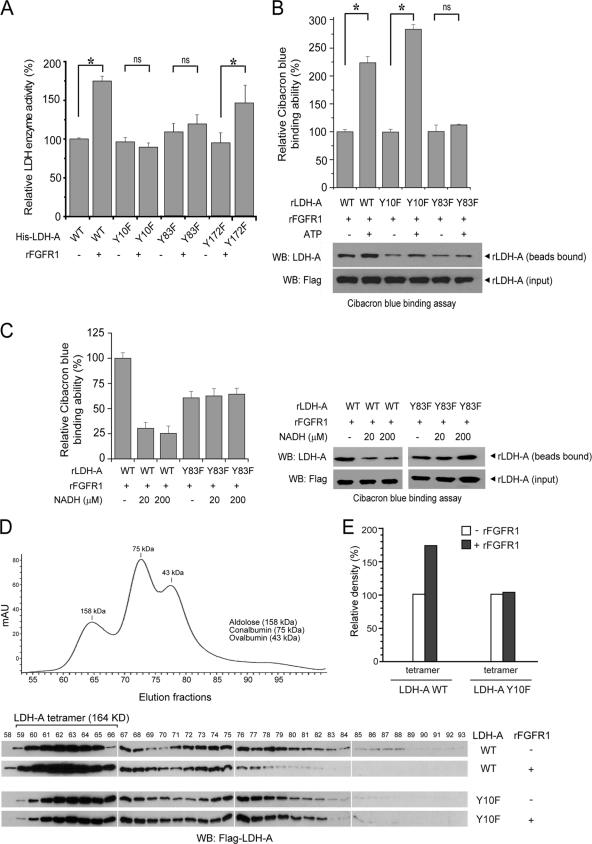
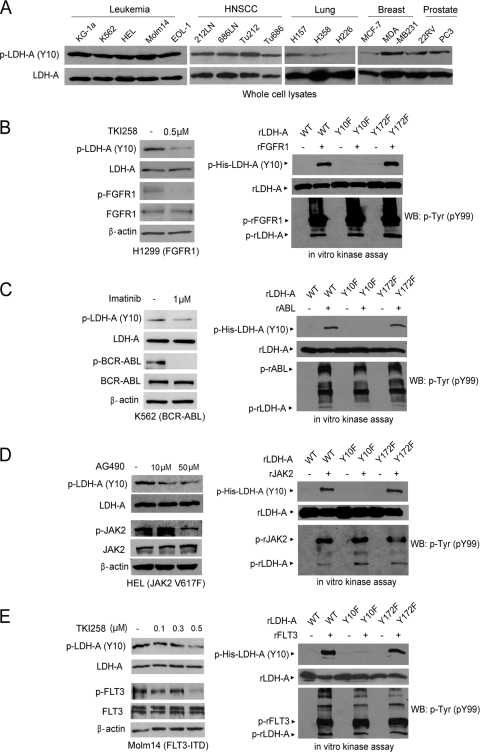
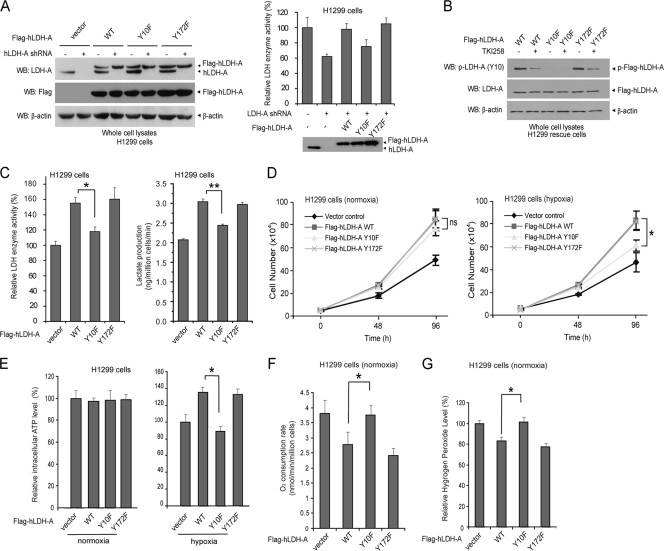
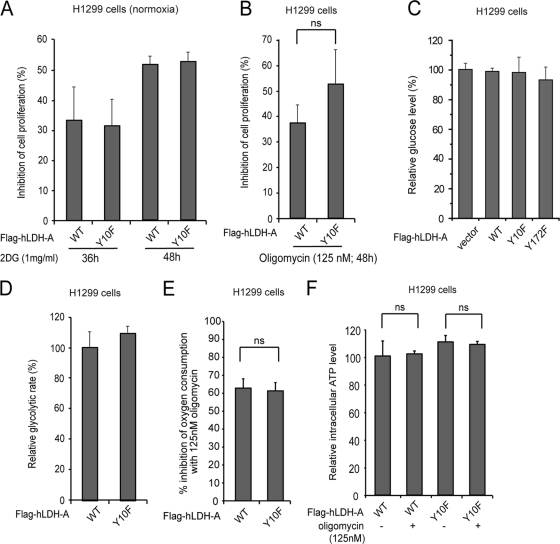
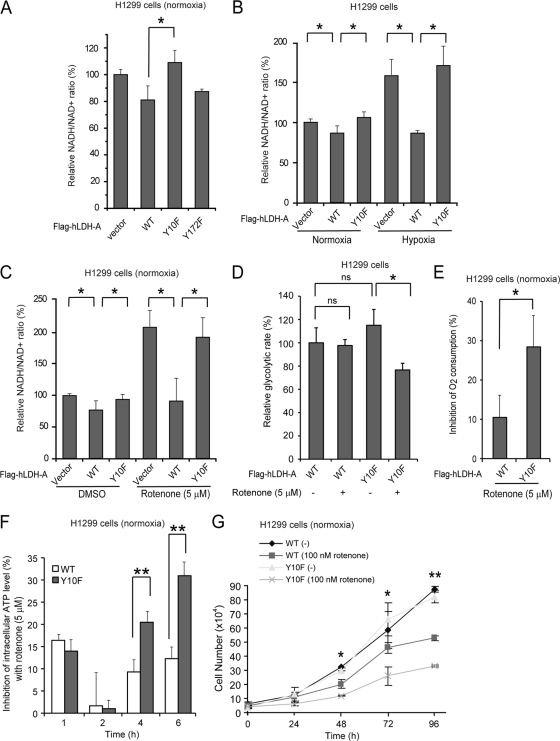
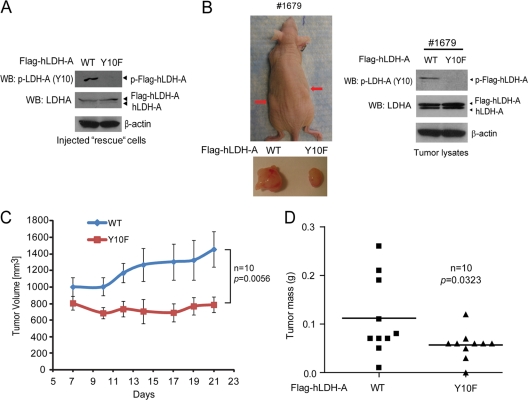
The Warburg effect describes an increase in aerobic glycolysis and enhanced lactate production in cancer cells. Lactate dehydrogenase A (LDH-A) regulates the last step of glycolysis that generates lactate and permits the regeneration of NAD(+). LDH-A gene expression is believed to be upregulated by both HIF and Myc in cancer cells to achieve increased lactate production. However, how oncogenic signals activate LDH-A to regulate cancer cell metabolism remains unclear. We found that the oncogenic receptor tyrosine kinase FGFR1 directly phosphorylates LDH-A. Phosphorylation at Y10 and Y83 enhances LDH-A activity by enhancing the formation of active, tetrameric LDH-A and the binding of LDH-A substrate NADH, respectively. Moreover, Y10 phosphorylation of LDH-A is common in diverse human cancer cells, which correlates with activation of multiple oncogenic tyrosine kinases. Interestingly, cancer cells with stable knockdown of endogenous LDH-A and rescue expression of a catalytic hypomorph LDH-A mutant, Y10F, demonstrate increased respiration through mitochondrial complex I to sustain glycolysis by providing NAD(+). However, such a compensatory increase in mitochondrial respiration in Y10F cells is insufficient to fully sustain glycolysis. Y10 rescue cells show decreased cell proliferation and ATP levels under hypoxia and reduced tumor growth in xenograft nude mice. Our findings suggest that tyrosine phosphorylation enhances LDH-A enzyme activity to promote the Warburg effect and tumor growth by regulating the NADH/NAD(+) redox homeostasis, representing an acute molecular mechanism underlying the enhanced lactate production in cancer cells.


Figures

Fig. 1.
Fig. 1.
Oncogenic FGFR1 phosphorylates and activates LDH-A. (A) Immunoblotting of 293T cell lysates for tyrosine phosphorylation of GST-LDH-A when coexpressed with FGFR1 wild type (WT) or a kinase-dead form (KD). (B) Active rFGFR1 directly phosphorylates purified, recombinant His-tagged LDH-A at tyrosine residues in an in vitro kinase assay (lower) and activates LDH-A enzyme activity (upper; **, P < 0.01). (C) GST-LDH-A was pulled down by beads from transfected 293T cell lysates and treated with active rFGFR1. Tyrosine phosphorylation of GST-LDH-A activates LDH-A enzyme activity (*, 0.01 < P < 0.05). (D) Inhibition of FGFR1 by tyrosine kinase inhibitor TKI258 does not alter LDH-A protein levels (left) but results in decreased lactate production (middle) and reduced LDH enzyme activity (right) in leukemia KG-1a cells (FOP2-FGFR1) (**, P < 0.01). Relative lactate production and LDH activity were normalized to those in control cells without TKI258 treatment. (E) Treatment with the tyrosine phosphatase inhibitor pervanadate (0.5 mM for 15 min) results in increased LDH enzyme activity in lung cancer H1299 cells expressing FGFR1 (*, 0.01 < P < 0.05). Relative LDH activity was normalized to that in control cells without pervanadate treatment. (F) In the top panel a schematic representation of LDH-A is shown. The four phosphorylated tyrosine residues are indicated, including FGFR1-direct phosphorylation sites (Y10 and Y83) and FGFR1-indirect phosphorylation sites (Y172 and Y239). In the bottom panel, Y10 and Y83 phosphorylation of LDH-A was determined by mass spectrometry. Recombinant LDH-A phosphorylated by active, recombinant FGFR1 was applied to SDS-PAGE, and the band containing LDH-A was excised, followed by in-gel digestion with trypsin. The resulting peptides were harvested and analyzed by reversed-phase liquid chromatography-tandem mass spectrometry (LC-MS/MS). MS/MS scan of the precursor ions m/z 1,078.0 (left) and m/z 546.2 (right), which were fragmented into multiple labeled product ions (b and y ions), led to identification of two peptides harboring Y10 and Y83, respectively, according to the mass shift (+80 Da) due to phosphorylation. The neutral loss of water also occurred during the fragmentation. Y10 was also identified as phosphorylated in another peptide (DQLIYNLLK) with m/z 600.3 (data not shown).
Fig. 2.
Fig. 2.
FGFR1 activates LDH-A via phosphorylation at Y10 and Y83, which promotes formation of active, tetrameric LDH-A and cofactor NADH binding, respectively. (A) Mutational analysis revealed that substitution of Y10 or Y83, but not Y172, abolishes FGFR1-dependent increase of LDH-A enzyme activity (ns, not significant; *, 0.01 < P < 0.05). Relative enzyme activity was normalized to that of sample using His-LDH-A WT without rFGFR1 treatment. (B) His-LDH-A WT, Y10F, or Y83F were incubated with rFGFR1 in the presence or absence of ATP, followed by incubation with Cibacron Blue 3GA agarose. Relative Cibacron Blue-binding (NADH binding [top]) that was normalized to each His-LDH-A variant in the absence of ATP was determined based on the relative intensity of each bound His-LDH-A protein (bottom), which was normalized to the individual input amount of protein (*, 0.01 < P < 0.05; ns, not significant). All experiments were performed at least three times with similar results. (C) Incubation with NADH results in decreased LDH-A WT but not Y83F mutant amounts bound to the Cibacron Blue agarose beads upon phosphorylation by rFGFR1. Relative Cibacron Blue binding (left) that was normalized to His-LDH-A WT in the presence of rFGFR1 and ATP but absence of NADH was determined based on the relative intensity of each bound His-LDH-A protein (right), which was normalized to the individual input amount of protein. (D) Purified recombinant LDH-A WT and Y10F proteins were incubated with active, recombinant FGFR1 in the in vitro kinase assay, followed by gel filtration chromatography. The collected fractions were analyzed by Western blotting. (E) Summary results of combined densitometry of LDH-A bands in fractions 59 to 66, which represent tetrameric LDH-A proteins.
Fig. 3.
Fig. 3.
LDH-A is specifically phosphorylated at Y10 in various cancer cell lines and by diverse oncogenic tyrosine kinases. (A) Immunoblotting detected Y10 phosphorylation of LDH-A in diverse leukemia (KG-1a, K562, HEL, Molm14, and EOL-1) cell lines and solid tumor cell lines, including head and neck cancer (212LN, 686LN, Tu212, and Tu686), lung cancer (H157 and H358), breast cancer (MDA-MB231), and prostate cancer (22RV and PC3), whereas LDH-A is relatively less phosphorylated in lung cancer H226 and breast cancer MCF-7 cells. (B to E) Immunoblotting shows that targeting FGFR1 by TKI258 in H1299 cells (B; left), BCR-ABL by imatinib in K562 cells (C; left), JAK2 by AG490 in HEL cells (D; left), or FLT3 in Molm14 cells by TKI258 (E; left) decreases phosphorylation of LDH-A Y10. Active, recombinant FGFR1 (B; right), ABL (C; right), JAK2 (D; right), and FLT3 (E; right) directly phosphorylate LDH-A at Y10 in corresponding in vitro kinase assays. Experiments were performed at least three times with similar results.
Fig. 4.
Fig. 4.
Expression of a catalytically less active LDH-A mutant, Y10F, in H1299 cells leads to decreased proliferation and ATP levels under hypoxic conditions with increased mitochondrial respiration. (A) Immunoblotting (left panel) shows shRNA-mediated stable knockdown of endogenous hLDH-A in H1299 cells using lentiviral transduction and rescue expression of Flag-tagged hLDH-A proteins, including WT, Y10F, and Y172F mutants. An LDH enzyme activity assay (right panel) using LDH-A knockdown and diverse rescue cell lines was performed. (B) Rescue expressed Flag-LDH-A WT and Y172F mutant, but not Y10F mutant, were phosphorylated at Y10 in H1299 cells expressing FGFR1. Treatment with TKI258 resulted in decreased Y10 phosphorylation of LDH-A in WT and Y172F rescue cells. (C) Y10F has significantly lower enzyme activity than Flag-hLDH-A WT or Y172F in rescue H1299 cells (left). Y10F rescue cells show significantly reduced lactate production under normoxia (right). (D to E) Rescue expression of hLDH-A Y10F in H1299 cells results in reduced cell proliferation rate (D) and intracellular ATP level (E) under hypoxic conditions (1%) but not at normal oxygen tension (normoxic; 17% oxygen) compared to cells expressing LDH-A WT or Y172F mutant. Cell proliferation was determined by the increase in cell number 96 h after seeding compared to that at seeding for each cell line (T = 0). The error bars represent mean values ± standard deviation from three independent experiments (*, 0.01 < P < 0.05). (F and G) Y10F rescue cells have a significantly elevated oxygen consumption rate (F) and an increased hydrogen peroxide production under normoxia (G) compared to cells expressing hLDH-A WT or Y172F mutant (*, 0.01 < P < 0.05). All of the experiments were performed at least three times with similar results.
Fig. 5.
Fig. 5.
Y10F rescue H1299 cells do not show increased oxidative phosphorylation. (A) Treatment with 2DG (1 mg/ml) resulted in a reduced proliferation rate of Y10F cells that was comparable to that of cells with hLDH-A WT. (B) Treatment with oligomycin (125 nM) for 48 h resulted in a reduced proliferation rate of Y10F cells that was comparable to that of cells with hLDH-A WT (ns = not significant). (C and D) Rescue cells expressing hLDH-A WT or Y10F have comparable glucose consumption rates (C) and glycolytic rates (D). (E and F) Oligomycin treatment resulted in comparable inhibition of oxygen consumption rates in both LDH-A WT and Y10F rescue cells (E) but did not affect the intracellular ATP levels in these cells (F).
Fig. 6.
Fig. 6.
Y10F rescue H1299 cells rely more on mitochondrial complex I to sustain glycolysis by providing NAD+ compared to cells with LDH-A WT. (A) Y10F rescue cells show a significantly increased NADH/NAD+ ratio compared to cells with hLDH-A WT or Y172F mutant (*, 0.01 < P < 0.05). (B) Control LDH-A knockdown cells harboring an empty vector and Y10F rescue cells show a significantly increased NADH/NAD+ ratio compared to cells with hLDH-A WT under normoxia, and switching to hypoxic condition results in a significantly elevated NADH/NAD+ ratio compared to cells expressing LDH-A WT (*, 0.01 < P < 0.05). (C) Treatment of rescue cells harboring an empty vector or Y10F with rotenone leads to a significantly elevated NADH/NAD+ ratio compared to cells expressing LDH-A WT (*, 0.01 < P < 0.05). (D) Rotenone treatment resulted in a significantly decreased glycolytic rate in the Y10F rescue cells but not cells expressing LDH-A WT (*, 0.01 < P < 0.05). (E to G) Inhibition of mitochondrial complex I by rotenone results in a significantly increased inhibition of oxygen consumption rate (E) and ATP levels (F; after 4 h treatment), as well as a slower proliferation rate (G) in Y10F rescue cells, compared to those in cells with hLDH-A WT. At 48, 72, and 96 h, the decreased proliferation rates of the Y10F cells compared to cells with hLDH-A WT were statistically significant, as assessed by using the Student t test (*, 0.01 < P < 0.05; **, P < 0.01). All experiments were performed at least three times with similar results.
Fig. 7.
Fig. 7.
Expression of LDH-A Y10F mutant in cancer cells leads to reduced tumor growth in xenograft nude mice. (A) Expression of Flag-tagged hLDH-A WT and Y10F detected by immunoblotting in injected rescue cells. Phosphorylation of LDH-A at Y10 was detected in LDH-A WT cells but not in cells expressing Y10F mutant. (B) The left panel shows dissected tumors (indicated by red arrows) in a representative nude mouse (animal 1679) injected with hLDH-A WT H1299 cells on the left flank and Y10F H1299 cells on the right flank are shown. In the right panel, the expression of hLDH-A WT and Y10F in tumor lysates was evaluated. (C and D) Y10F rescue cells show significantly reduced tumor growth rate (C; the P value was determined by a one-tailed Student t test) and masses (D; the P value was determined by a paired Student t test) in xenograft nude mice compared to cells with hLDH-A WT.

References

    1. Brahimi-Horn M. C., Chiche J., Pouyssegur J. 2007. Hypoxia signalling controls metabolic demand. Curr. Opin. Cell Biol. 19:223–229 - PubMed
    1. Bui T., Thompson C. B. 2006. Cancer's sweet tooth. Cancer Cell 9:419–420 - PubMed
    1. Dang C. V. 2009. PKM2 tyrosine phosphorylation and glutamine metabolism signal a different view of the Warburg effect. Sci. Signal. 2:pe75. - PubMed
    1. Durisova V., Vrbanova A., Ziegelhoffer A., Breier A. 1990. Interaction of Cibacron Blue 3GA and Remazol Brilliant Blue R with the nucleotide binding site of lactate dehydrogenase and (Na+ + K+)-ATPase. Gen. Physiol. Biophys. 9:519–528 - PubMed
    1. Fantin V. R., St-Pierre J., Leder P. 2006. Attenuation of LDH-A expression uncovers a link between glycolysis, mitochondrial physiology, and tumor maintenance. Cancer Cell 9:425–434 - PubMed

Publication types

MeSH terms