Duodenal and faecal microbiota of celiac children: molecular, phenotype and metabolome characterization
- PMID: 21970810
- PMCID: PMC3206437
- DOI: 10.1186/1471-2180-11-219
Duodenal and faecal microbiota of celiac children: molecular, phenotype and metabolome characterization
Abstract
Background: Epidemiology of celiac disease (CD) is increasing. CD mainly presents in early childhood with small intestinal villous atrophy and signs of malabsorption. Compared to healthy individuals, CD patients seemed to be characterized by higher numbers of Gram-negative bacteria and lower numbers Gram-positive bacteria.
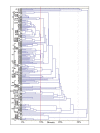
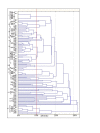
Results: This study aimed at investigating the microbiota and metabolome of 19 celiac disease children under gluten-free diet (treated celiac disease, T-CD) and 15 non-celiac children (HC). PCR-denaturing gradient gel electrophoresis (DGGE) analyses by universal and group-specific primers were carried out in duodenal biopsies and faecal samples. Based on the number of PCR-DGGE bands, the diversity of Eubacteria was the higher in duodenal biopsies of T-CD than HC children. Bifidobacteria were only found in faecal samples. With a few exceptions, PCR-DGGE profiles of faecal samples for Lactobacillus and Bifidobacteria differed between T-CD and HC. As shown by culture-dependent methods, the levels of Lactobacillus, Enterococcus and Bifidobacteria were confirmed to be significantly higher (P = 0.028; P = 0.019; and P = 0.023, respectively) in fecal samples of HC than in T-CD children. On the contrary, cell counts (CFU/ml) of presumptive Bacteroides, Staphylococcus, Salmonella, Shighella and Klebsiella were significantly higher (P = 0.014) in T-CD compared to HC children. Enterococcus faecium and Lactobacillus plantarum were the species most diffusely identified. This latter species was also found in all duodenal biopsies of T-CD and HC children. Other bacterial species were identified only in T-CD or HC faecal samples. As shown by Randomly Amplified Polymorphic DNA-PCR analysis, the percentage of strains identified as lactobacilli significantly (P = 0.011) differed between T-CD (ca. 26.5%) and HC (ca. 34.6%) groups. The metabolome of T-CD and HC children was studied using faecal and urine samples which were analyzed by gas-chromatography mass spectrometry-solid-phase microextraction and 1H-Nuclear Magnetic Resonance. As shown by Canonical Discriminant Analysis of Principal Coordinates, the levels of volatile organic compounds and free amino acids in faecal and/or urine samples were markedly affected by CD.
Conclusion: As shown by the parallel microbiology and metabolome approach, the gluten-free diet lasting at least two years did not completely restore the microbiota and, consequently, the metabolome of CD children. Some molecules (e.g., ethyl-acetate and octyl-acetate, some short chain fatty acids and free amino acids, and glutamine) seems to be metabolic signatures of CD.
Figures


Similar articles
-
Different fecal microbiotas and volatile organic compounds in treated and untreated children with celiac disease.Appl Environ Microbiol. 2009 Jun;75(12):3963-71. doi: 10.1128/AEM.02793-08. Epub 2009 Apr 17. Appl Environ Microbiol. 2009. PMID: 19376912 Free PMC article.
-
Salivary microbiota and metabolome associated with celiac disease.Appl Environ Microbiol. 2014 Jun;80(11):3416-25. doi: 10.1128/AEM.00362-14. Epub 2014 Mar 21. Appl Environ Microbiol. 2014. PMID: 24657864 Free PMC article.
-
Salivary and fecal microbiota and metabolome of celiac children under gluten-free diet.Int J Food Microbiol. 2016 Dec 19;239:125-132. doi: 10.1016/j.ijfoodmicro.2016.07.025. Epub 2016 Jul 19. Int J Food Microbiol. 2016. PMID: 27452636 Review.
-
Differences in faecal bacteria populations and faecal bacteria metabolism in healthy adults and celiac disease patients.Biochimie. 2012 Aug;94(8):1724-9. doi: 10.1016/j.biochi.2012.03.025. Epub 2012 Apr 20. Biochimie. 2012. PMID: 22542995
-
Microbial-derived peptidases are altered in celiac disease, non-celiac gluten sensitivity, and functional dyspepsia: a systematic review and re-analysis of the duodenal microbiome.Gut Microbes. 2025 Dec;17(1):2500063. doi: 10.1080/19490976.2025.2500063. Epub 2025 May 9. Gut Microbes. 2025. PMID: 40346812 Free PMC article.
Cited by
-
Probiotics, Prebiotics and Other Dietary Supplements for Gut Microbiota Modulation in Celiac Disease Patients.Nutrients. 2020 Sep 2;12(9):2674. doi: 10.3390/nu12092674. Nutrients. 2020. PMID: 32887325 Free PMC article. Review.
-
Cross-Talk Between Gluten, Intestinal Microbiota and Intestinal Mucosa in Celiac Disease: Recent Advances and Basis of Autoimmunity.Front Microbiol. 2018 Nov 1;9:2597. doi: 10.3389/fmicb.2018.02597. eCollection 2018. Front Microbiol. 2018. PMID: 30443241 Free PMC article. Review.
-
Beneficial metabolic transformations and prebiotic potential of hemp bran and its alcalase hydrolysate, after colonic fermentation in a gut model.Sci Rep. 2023 Jan 27;13(1):1552. doi: 10.1038/s41598-023-27726-w. Sci Rep. 2023. PMID: 36707683 Free PMC article.
-
Metabolomic Profiling in Children with Celiac Disease: Beyond the Gluten-Free Diet.Nutrients. 2023 Jun 25;15(13):2871. doi: 10.3390/nu15132871. Nutrients. 2023. PMID: 37447198 Free PMC article. Review.
-
Changes in Diet and Anthropometric Parameters in Children and Adolescents with Celiac Disease-One Year of Follow-Up.Nutrients. 2021 Nov 28;13(12):4306. doi: 10.3390/nu13124306. Nutrients. 2021. PMID: 34959858 Free PMC article.
References
-
- Tye-Din J, Anderson R. Immunopathogenesis of celiac disease. Curr Gastroenterol Rep. 2008;10:458–465. - PubMed
-
- Fasano A, Catassi C. Coeliac disease in children. Best Pract Res Cl Ga. 2005;19:467–478. - PubMed
-
- Cosnes J, Cellier C, Viola S, Colombel J, Michaud L, Sarles J, Hugot J, Ginies J, Dabadies A, Mouterde O, Allea M, Nion-Lameurier I. the group De'Tude Et De Recherche Sur La Maladie Coeliaque. Incidence of autoimmune diseases in celiac disease: protective effect of the gluten-free diet. Clin Gastroenterol Hepatol. 2008;6:753–758. - PubMed
-
- Malandrino N, Capristo E, Farneti S, Leggio L, Abenavoli L, Addolorato G, Gasbarrini G. Metabolic and nutritional features in adult celiac patients. Dig Dis. 2008;26:128–133. - PubMed
Publication types
MeSH terms
Substances
LinkOut - more resources
Full Text Sources
Other Literature Sources
Medical
Molecular Biology Databases
Research Materials

