. 2011 Dec 9;286(49):42704-42714.
doi: 10.1074/jbc.M111.268169. Epub 2011 Oct 4.

The Escherichia coli clamp loader can actively pry open the β-sliding clamp

Affiliations

The Escherichia coli clamp loader can actively pry open the β-sliding clamp

Christopher O Paschall et al. J Biol Chem. .

Abstract

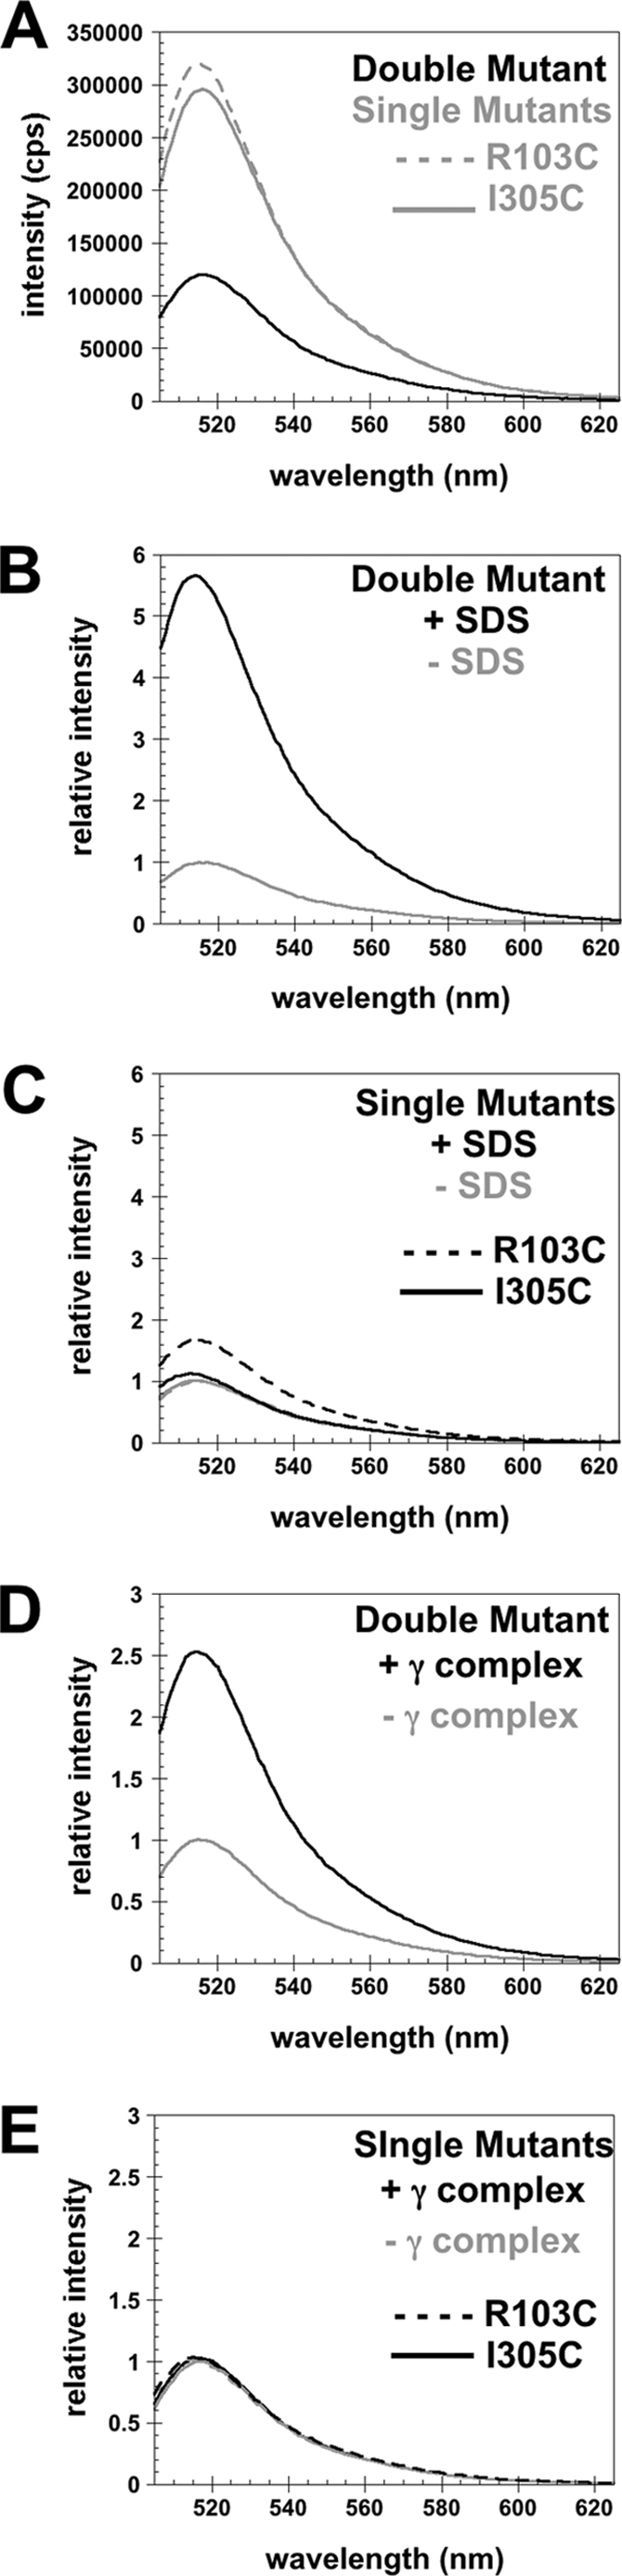
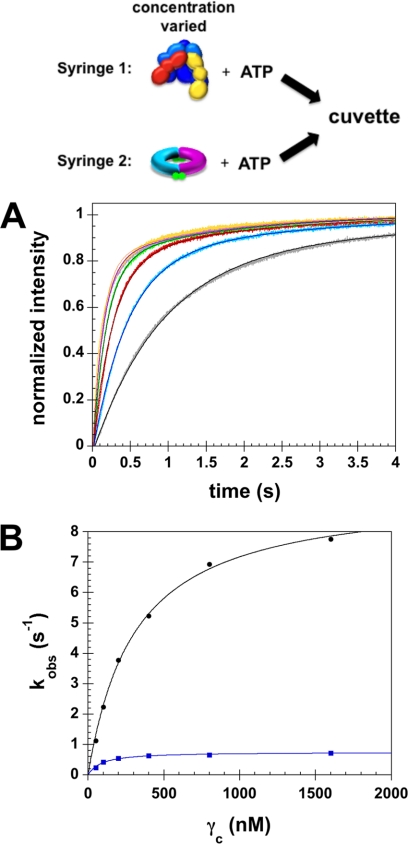
Clamp loaders load ring-shaped sliding clamps onto DNA. Once loaded onto DNA, sliding clamps bind to DNA polymerases to increase the processivity of DNA synthesis. To load clamps onto DNA, an open clamp loader-clamp complex must form. An unresolved question is whether clamp loaders capture clamps that have transiently opened or whether clamp loaders bind closed clamps and actively open clamps. A simple fluorescence-based clamp opening assay was developed to address this question and to determine how ATP binding contributes to clamp opening. A direct comparison of real time binding and opening reactions revealed that the Escherichia coli γ complex binds β first and then opens the clamp. Mutation of conserved "arginine fingers" in the γ complex that interact with bound ATP decreased clamp opening activity showing that arginine fingers make an important contribution to the ATP-induced conformational changes that allow the clamp loader to pry open the clamp.


Figures

FIGURE 1.
FIGURE 1.
Structure of the β mutant used in the clamp opening assay. A, the ribbon diagram in the upper panel shows a top view of β from the face to which the γ complex binds. One monomer is colored in cyan, and the other is in magenta. Amino acid residues Cys-103 and Cys-305 are shown as spheres colored by atoms with carbon in white, nitrogen in blue, oxygen in red, and sulfur in yellow. The lower panel shows an edge view of the same structure in which the γ complex would bind with the top face of the clamp. B, an overlay of structures of β-wt (orange, PDB ID 1MMI (24)) and the β-AF4882 (blue, PDB ID 3PWE) are shown in an edge view. The β strands on either side of the monomer interface are shown as sticks with wild-type Arg-103 and Ile-305 and mutant Cys-103 and Cys-305 colored by atoms with carbon in yellow, nitrogen in blue, oxygen in red, and sulfur in orange. The upper panel shows one interface with r.m.s. deviation values for the backbone between the wild-type and mutant structures of 0.11 Å for residues 103–109 in the A subunit and 0.14 Å for residues 298–307 in the B subunit. The lower panel shows the opposite dimer interface with r.m.s. deviation values of 0.06 Å for residues 103–109 in the B subunit and 0.29 Å for residues 298–307 in the A subunit. r.m.s. deviations were calculated using Coot (27).
FIGURE 2.
FIGURE 2.
A comparison of β single and double mutants shows that physical separation of the two AF488 fluorophores in the double mutant relieves self-quenching. A, shown are emission spectra of 10 nm solutions of the AF488-labeled single mutants (R103C, gray dashed line and I305C, gray solid line) and double mutant (R103C/I305C, black line) in assay buffer. B and C, show emission spectra of 10 nm solutions of the double and single mutants, respectively, in solutions of assay buffer with (black trace) and without (gray trace) 5% SDS. The R103C single mutant is shown in dashed lines, and I305C single mutant is shown in solid lines. D and E show emission spectra of 10 nm solutions of the double and single mutants, respectively, in solutions containing 0.5 mm ATP in assay buffer with (black trace) and without (gray trace) 150 nm γ complex. The R103C single mutant is shown in dashed lines, and I305C single mutant is shown in solid lines. All spectra were recorded using a 495-nm excitation wavelength and a 3-nm bandpass. Assay buffer contains 20 mm Tris-HCl, pH 7.5, 50 mm NaCl, and 8 mm MgCl2.
FIGURE 3.
FIGURE 3.
Equilibrium binding of γ complex to β. A, the relative intensity of AF488 at 517 nm is plotted as a function of γ complex concentration for solutions containing 10 nm β-AF4882 and 0.5 mm ATP. Data from individual experiments were fit Equation 1 (“Experimental Procedures”) to calculate an average dissociation constant, Kd, of 3.3 ± 0.2 nm. B, competition binding of γ complex to wt unlabeled β versus β-AF4882 was measured in assays containing 20 nm γ complex, 20 nm β-AF4882, 0.5 mm ATP, and increasing concentrations of unlabeled β-wt. The relative fluorescence of AF488 is plotted as a function of the concentration of the unlabeled β competitor. Data were fit to Equation 2 (“Experimental Procedures”) to calculate an average Kd value of 3.2 ± 0.4 nm for β-wt.
FIGURE 4.
FIGURE 4.
Clamp closing in real time by active clamp loading and passive dissociation reactions. A, the γ complex was preincubated with β and ATP for 4 s before adding a solution of DNA, ATP, and a 10-fold excess (“xs”) of unlabeled β. The decrease in fluorescence that occurred when the clamp was loaded onto DNA and closed was measured as a function of time. The solid gray line through the trace is a single exponential fit to the data to calculate an observed closing rate of 4.9 s−1. The DNA substrate used in this experiment was a 60/60-mer duplex annealed to create two 3′ recessed ends with 30-nucleotide 5′ single-stranded DNA overhangs. B, clamp closing that occurs when the clamp “passively” dissociates from the clamp loader was measured under identical reaction conditions except that DNA was omitted. The passive dissociation reaction (upper gray trace) was fit by exponentials to calculate a closing rate of 0.027 s−1. For comparison, the reaction with DNA (lower black trace) is plotted on the same time scale. Final concentrations were 20 nm γ complex, 20 nm β-AF4882, 0.5 mm ATP, 200 nm unlabeled β, and 40 nm DNA when present.
FIGURE 5.
FIGURE 5.
Effects of ATP and arginine finger mutations on clamp binding and opening. A and B, clamp binding and clamp opening in assays with 0.5 mm ATP (gray bars) and without ATP (black bars) were measured. The γ complex and ATP were added sequentially to solutions of 100 nm β-PY or 100 nm β-AF4882 to measure clamp loader-clamp binding (panel A) and clamp opening (panel B), respectively. Relative intensities of PY at 375 nm and AF488 at 517 nm are plotted as a function of γ complex concentration. Intensities are relative to the values for solutions with no γ complex (0 nm γ complex). Average values from three independent experiments along with S.D. (error bars) are shown in each panel. C and D, wild-type γ complex contains three Arg fingers (illustrated by curved arrows in the scheme); one in the δ subunit that extends to the ATP site of the γ1 subunit, and one each in the γ1 and γ2 subunits that extend to the ATP sites of γ2 and γ3, respectively. Two γ complex mutants were made that contain either an Arg-158 to Ala in the δ′ subunit (δ′-R158A) or an Arg-169 to Ala in the γ subunits (γ-R169A) (21). Binding of γ-wt complex to β-PY was measured in the presence (black triangles) and absence (gray triangles) of 0.5 mm ATP, and binding of the δ′-R158A mutant (squares) and the γ-R169A mutant (circles) to β-PY were measured in the presence of 0.5 mm ATP (panel C). For each clamp loader, PY emission at 375 nm for the β-PY-clamp loader complex relative to free β-PY is plotted as a function of γ complex concentration for solutions containing 10 nm β-PY and 0.5 mm ATP (when present). Clamp opening (panel D) was measured for wild-type γ complex (triangles), the δ′-R158A mutant (squares), and the γ-R169A (circles) mutant in assays with 10, 2, and 5 nm β-AF4882, respectively, and 0.5 mm ATP. For each clamp loader concentration, AF488 emission at 517 nm relative to free β-AF4882 is plotted. Data shown are the average of three independent experiments.
FIGURE 6.
FIGURE 6.
Rates of clamp binding versus clamp opening. A, stopped-flow fluorescence measurements were made in which a solution of γ complex and ATP was added to a solution of the β-clamp and ATP (see the mixing scheme). Final concentrations after mixing were 20 nm β, 400 nm γ complex, and 0.5 mm ATP. Clamp binding was measured using β-PY (blue trace) and clamp opening was measured using β-AF4882 (black trace). The relative intensities of PY (left axis) and AF488 (right axis) are plotted on the same graph to highlight the relative timing of clamp binding and opening. B, the data from panel A are shown on a shorter time scale.
FIGURE 7.
FIGURE 7.
Dependence of the clamp opening rate on the concentration of γ complex. Rates of clamp opening as a function of γ complex concentration were measured by mixing solutions of γ complex and ATP with a solution of β-AF4882 and ATP (see mixing scheme). A, time courses for opening reactions containing 50 (gray), 100 (light blue), 200 (red), 400 (light green), 800 (purple), or 1600 nm (yellow) γ complex and 20 nm β-AF4882 are shown. Double exponential fits of the data are solid lines through reaction traces in darker shades of the same colors. B, data in panel A were fit to double exponential rises, and observed rate constants for both the fast (black circles) and slow (blue squares) phases of the reactions are plotted as a function of γ complex concentration. These data were globally fit to Equation 3 as described under “Experimental Procedures” (solid lines). Rate constants were allowed to vary with γ complex concentration, but amplitudes for the rapid and slow phases were fit to the same values for all six data sets. This fit yielded maximal rate constants of 9.3 and 0.75 s−1 for the fast and slow phases, respectively, and an amplitude of 0.83 for the rapid phase, 0.20 for the slow phase, and a constant of −0.03.
FIGURE 8.
FIGURE 8.
The γ complex clamp loader actively opens the β-clamp. Clamp loaders must hold sliding clamps in an open conformation to load the clamps onto DNA. This open clamp loader-clamp complex could form by a passive mechanism in which clamp loaders have a high affinity for clamps that have transiently opened in solution and passively capture clamps in this open conformation (lower reaction pathway). Alternatively, clamp loaders could bind closed clamps and actively pry them open. Data in Figs. 5 and 6 show that clamp binding is faster than clamp opening, demonstrating that the E. coli clamp loader actively opens the β-clamp after binding as illustrated in the upper reaction pathway rather than passively capturing clamps that have transiently opened.

Similar articles

Cited by

References

    1. Gulbis J. M., Kelman Z., Hurwitz J., O'Donnell M., Kuriyan J. (1996) Cell 87, 297–306 - PubMed
    1. Kong X. P., Onrust R., O'Donnell M., Kuriyan J. (1992) Cell 69, 425–437 - PubMed
    1. Moarefi I., Jeruzalmi D., Turner J., O'Donnell M., Kuriyan J. (2000) J. Mol. Biol. 296, 1215–1223 - PubMed
    1. Shamoo Y., Steitz T. A. (1999) Cell 99, 155–166 - PubMed
    1. Leu F. P., Hingorani M. M., Turner J., O'Donnell M. (2000) J. Biol. Chem. 275, 34609–34618 - PubMed

Publication types

Associated data

LinkOut - more resources