. 2011 Dec;1807(12):1573-82.
doi: 10.1016/j.bbabio.2011.09.011. Epub 2011 Sep 24.

Nitric oxide and hypoxia exacerbate alcohol-induced mitochondrial dysfunction in hepatocytes

Affiliations

Nitric oxide and hypoxia exacerbate alcohol-induced mitochondrial dysfunction in hepatocytes

Blake R Zelickson et al. Biochim Biophys Acta. 2011 Dec.

Abstract

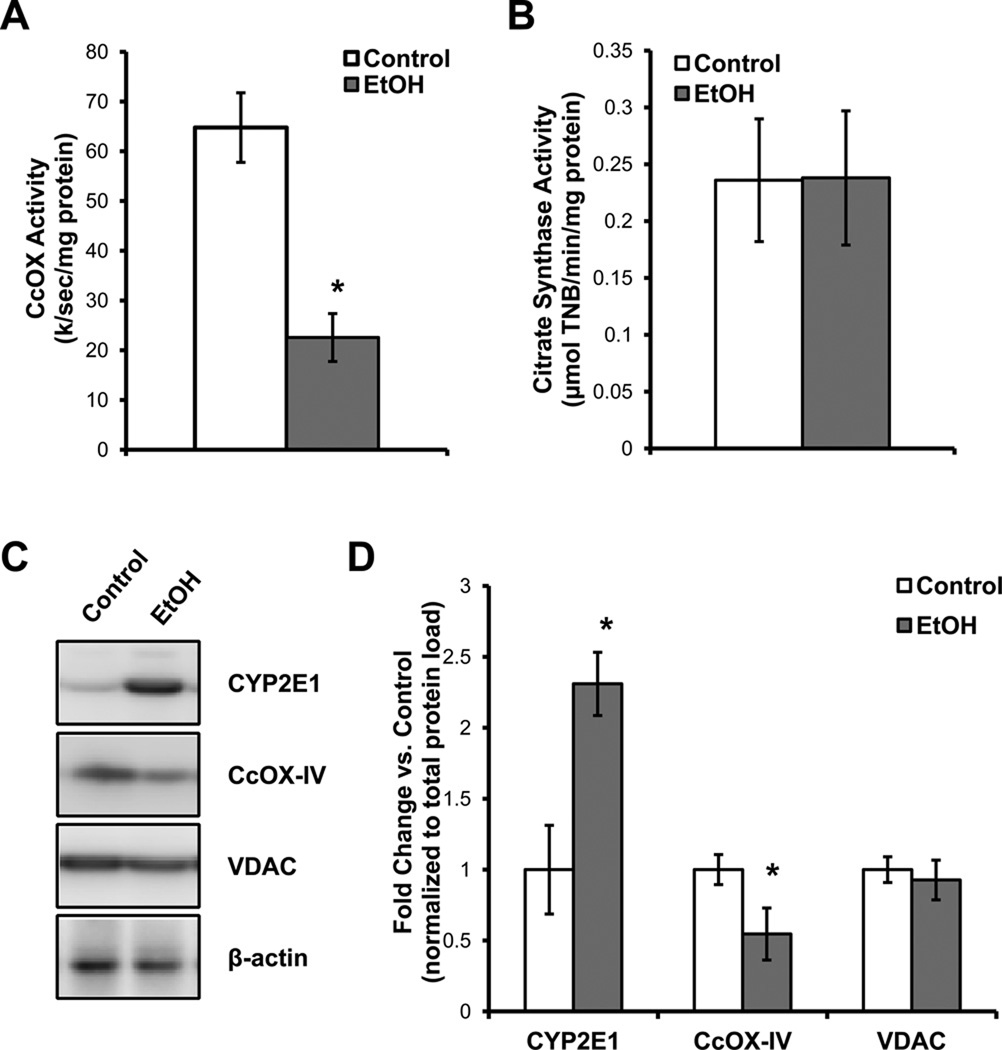
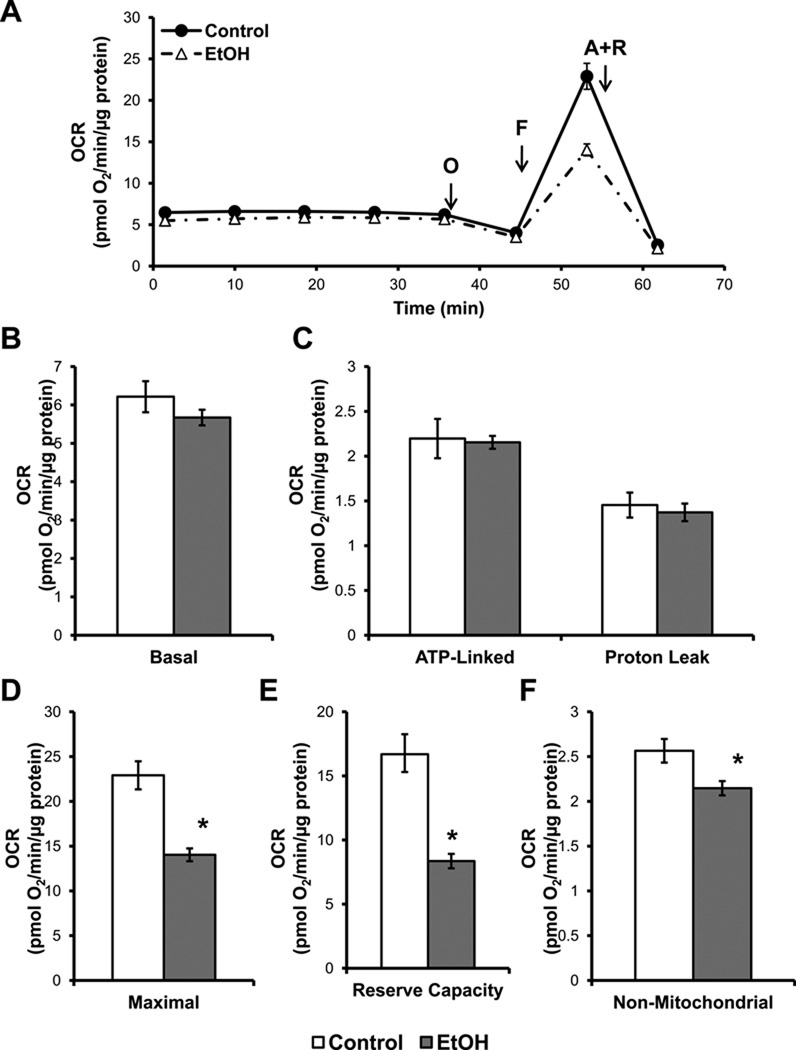
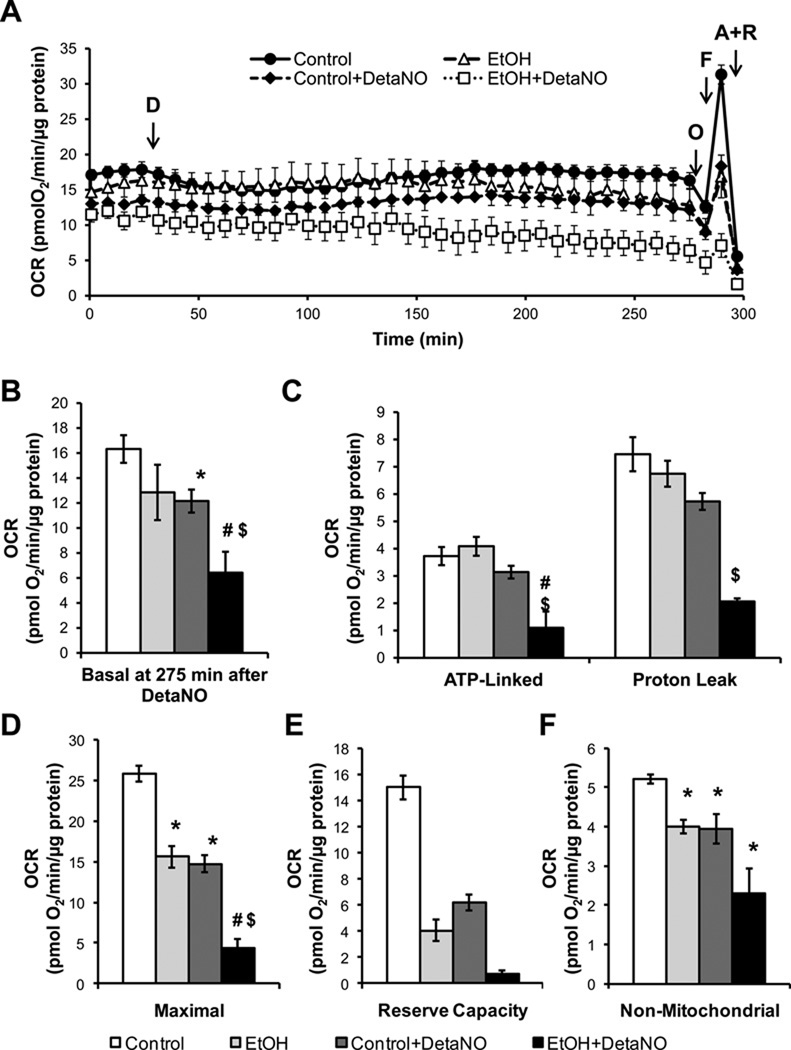
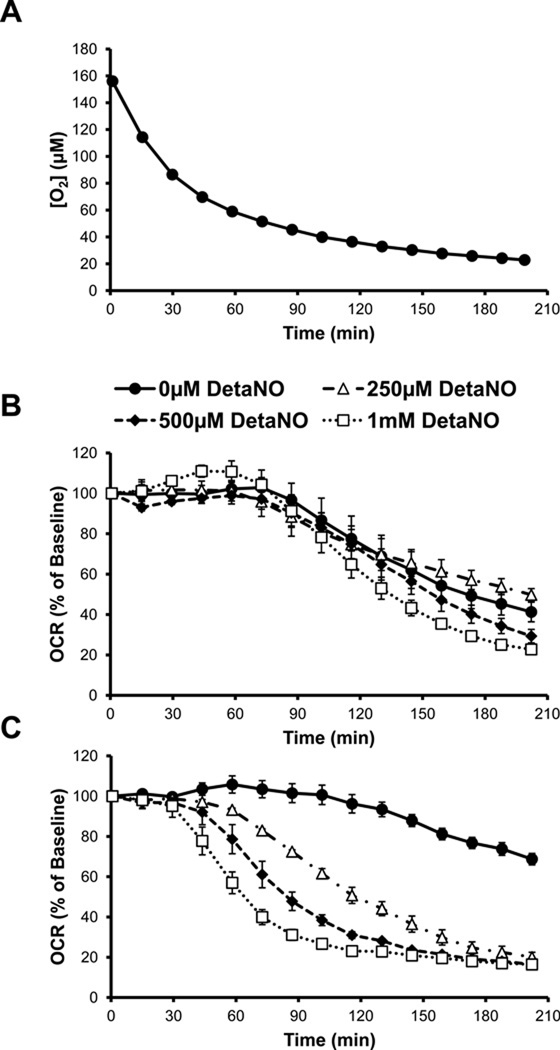
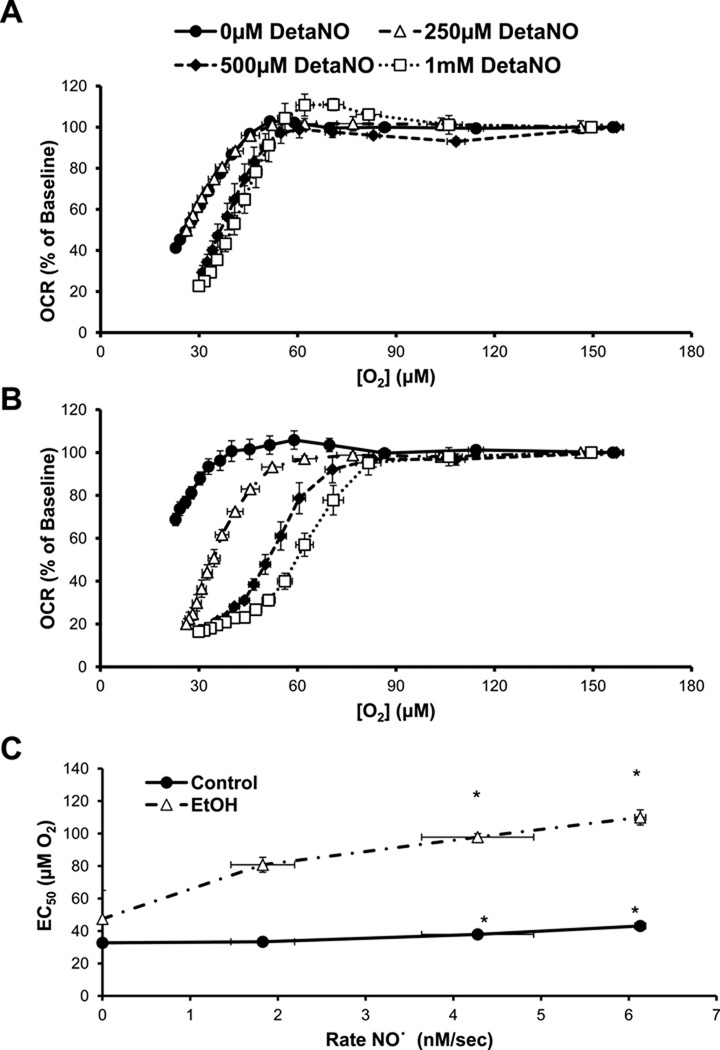
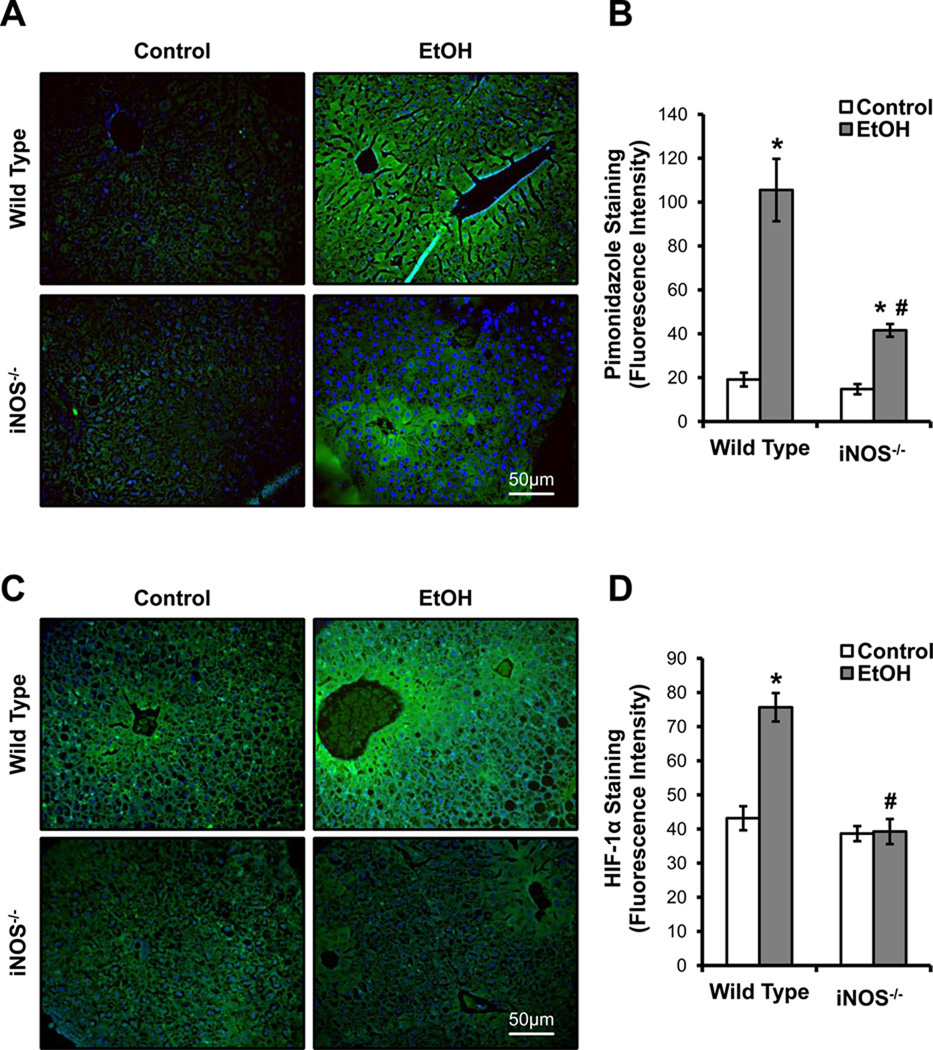
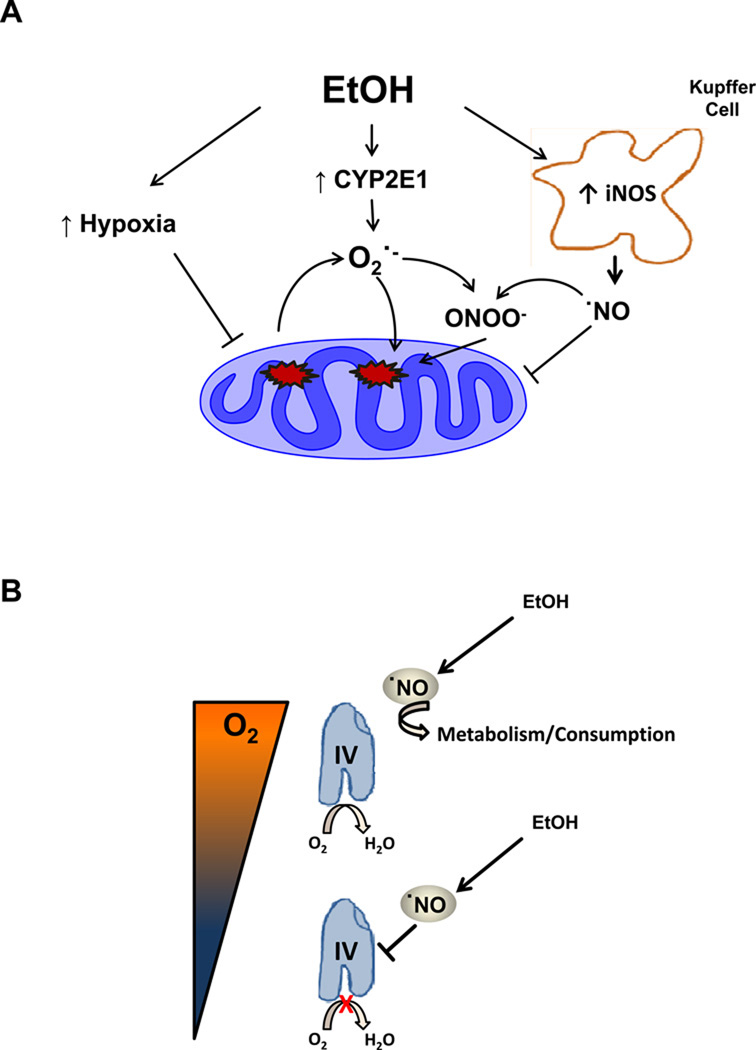
Chronic alcohol consumption results in hepatotoxicity, steatosis, hypoxia, increased expression of inducible nitric oxide synthase (iNOS) and decreased activities of mitochondrial respiratory enzymes. The impact of these changes on cellular respiration and their interaction in a cellular setting is not well understood. In the present study we tested the hypothesis that nitric oxide (NO)-dependent modulation of cellular respiration and the sensitivity to hypoxic stress is increased following chronic alcohol consumption. This is important since NO has been shown to regulate mitochondrial function through its interaction with cytochrome c oxidase, although at higher concentrations, and in combination with reactive oxygen species, can result in mitochondrial dysfunction. We found that hepatocytes isolated from alcohol-fed rats had decreased mitochondrial bioenergetic reserve capacity and were more sensitive to NO-dependent inhibition of respiration under room air and hypoxic conditions. We reasoned that this would result in greater hypoxic stress in vivo, and to test this, wild-type and iNOS(-/-) mice were administered alcohol-containing diets. Chronic alcohol consumption resulted in liver hypoxia in the wild-type mice and increased levels of hypoxia-inducible factor 1 α in the peri-venular region of the liver lobule. These effects were attenuated in the alcohol-fed iNOS(-/-) mice suggesting that increased mitochondrial sensitivity to NO and reactive nitrogen species in hepatocytes and iNOS plays a critical role in determining the response to hypoxic stress in vivo. These data support the concept that the combined effects of NO and ethanol contribute to an increased susceptibility to hypoxia and the deleterious effects of alcohol consumption on liver.


Figures

Figure 1
Figure 1. Effect of alcohol (EtOH) consumption on mitochondrial protein levels and activity
(A) Cytochrome c oxidase (CcOX) activity in isolated hepatocytes from control and EtOH-fed rats. The activity is expressed as the first order rate constant for the oxidation of reduced cytochrome c (B) Citrate synthase activity in isolated hepatocytes from control and EtOH-fed rats and the activity is expressed as the formation of thionitrobenzoate (TNB). (C) Protein levels of cytochrome P450 2E1 (CYP2E1), cytochrome c oxidase subunit IV (CcOX-IV), voltage-dependent anion channel (VDAC), and β-actin from primary hepatocytes isolated from control and EtOH-fed rats, along with the quantification of the densitometry for the different proteins normalized to total protein and expressed as the fold change vs. control (D). Data are mean ± SEM. n=6 for each group. *p≤0.05 compared to control.
Figure 2
Figure 2. Chronic alcohol (EtOH) consumption decreases mitochondrial respiratory function in hepatocytes
Primary hepatocytes were isolated from rats fed control and EtOH-containing diets for 6 wk and were plated at 20,000 cells/well (20.1 ± 0.4 µg protein) for control and 40,000 cells/well for EtOH-exposed hepatocytes (21.0 ± 0.3 µg protein). Hepatocytes were allowed to attach overnight prior to oxygen consumption rate (OCR) measurements. (A) OCR traces from control and EtOH-fed hepatocytes with serial injections of oligomycin (O, 1 µg/mL), FCCP (F, 0.3 µM), and antimycin A plus rotenone (A+R, 10 µM and 1 µM, respectively) to determine parameters of mitochondrial function. (B) Basal OCR of hepatocytes is measured prior to injection. (C) ATP-linked respiration was calculated from the decrease in OCR following oligomycin injection, with the remainder being attributed to proton leak (D). (E) Maximal OCR was measured following FCCP injection. (F) The reserve capacity was calculated from the difference between the maximal and basal OCR and represents the spare respiratory capacity available to the hepatocytes for use under increased energy demand or stress. (G) The non-mitochondrial OCR of hepatocytes was determined by injecting antimycin A and rotenone simultaneously to fully inhibit the mitochondrial electron transport chain, thereby all remaining O2 consumption is due to extra-CcOX sources. Results are mean ± SEM. n=5 per group. *p<0.05 compared to control.
Figure 3
Figure 3. Chronic alcohol (EtOH) consumption sensitizes hepatocytes to nitric oxide (˙NO)-induced mitochondrial dysfunction
(A) The effect of ˙NO on respiration in hepatocytes isolated from control and alcohol (EtOH)-fed rats was determined by treating cells with DetaNONOate (D, 500 µM) for 4 hr followed by serial injections of oligomycin (O), FCCP (F), and antimycin A plus rotenone (A+R) to measure parameters of mitochondrial function. (B) Basal OCR (275 min post DetaNO) of hepatocytes is measured prior to oligomycin injection. (C) ATP-linked respiration is ascribed to the oligomycin-induced decrease in OCR and the remaining OCR following oligomycin injection is ascribed to proton leak. (D) Maximal OCR was measured following FCCP injection. (E) The reserve capacity was calculated from the difference between the maximal and basal OCR. (F) The non-mitochondrial OCR was determined by injecting antimycin A and rotenone simultaneously to fully inhibit the electron transport chain. Results expressed as percent of baseline (measurement prior to DetaNONOate or vehicle addition) and are mean ± SEM. Basal OCR values are 148 ± 3 pmol O2/min for control group and 118 ± 5pmol O2/min for the EtOH group. n=5 per group. *p<0.05 compared to Control. #p<0.05 compared to EtOH. $p<0.05 compared to Control + DetaNO.
Figure 4
Figure 4. Alcohol (EtOH) increases hepatocyte susceptibility to nitric oxide (˙NO)-induced inhibition of respiration during hypoxia
(A) Changes in O2 tension in the room air-equilibrated media above attached hepatocytes over time following exposure to 1% O2 atmosphere. The effect of 0–1000 µM DetaNONOate (DetaNO) added immediately prior to the start of the assay on oxygen consumption rate (OCR) of hepatocytes from control rats (B) and EtOH-fed rats (C) over time as O2 decreases as seen in (A). Results are mean ± SEM. n=5 per group. In panel B, all points in the 250 µM, 500 µM, and 1 mM DetaNO curves were significantly different from vehicle-treated from 188 min, 173 min, and 130 min, respectively. In panel C, all points in the 250 µM and 500 µM DetaNO curves were significantly different from vehicle-treated from 58 min and all points in the 1 mM DetaNO curve were significantly different from vehicle treated from 44 min. Results expressed as percent of baseline (measurement prior to DetaNO or vehicle addition) and are mean ± SEM. Basal OCR values are 153 ± 9 pmol O2/min for controls and 109 ± 9 pmol O2/min for the EtOH group. n=5 per group.
Figure 5
Figure 5. Chronic alcohol (EtOH) consumption alters hepatocyte response in OCR to decreasing O2 tension and nitric oxide (˙NO)
(A) The change in oxygen consumption rate (OCR) of control hepatocytes treated with DetaNONOate (DetaNO, 0–1000µM) was plotted as a function of the decreasing O2 tension of the media, as seen in Figure 4B. (B) The change in OCR of hepatocytes isolated from EtOH-fed rats pretreated with 0–1000 µM DetaNO is plotted as a function of the O2 tension of the media as it becomes hypoxic, as seen in Figure 4C. (C) The EC50 of the curves from panels A and B were calculated by fitting the data to a sigmoidal curve. Results are mean ± SEM. n=5 per group. *p<0.05 compared to respective vehicle-treated group.
Figure 6
Figure 6. Inducible nitric oxide synthase (iNOS)-derived nitric oxide (˙NO) is required for chronic alcohol-induced liver hypoxia
(A) Pimonidazole staining of formalin fixed liver sections from wild type and iNOS−/− mice with and without alcohol (EtOH) feeding was performed to assess liver hypoxia. (B) Quantification of the pimonidazole staining intensity from (A). Fluorescence microscopy was used to detect HIF-1α stabilization in liver sections from control and alcohol (EtOH)-fed wild type and iNOS−/− mice (C). The quantification of the immunofluorescence is shown in (D). Images are representative from each group and quantification results are mean ± SEM. n=6 per group. *p<0.05 compared to respective controls. #p<0.05 compared to EtOH-fed wild type mice.
Figure 7
Figure 7. Chronic alcohol consumption induces mitochondrial dysfunction mediated by nitric oxide and hypoxia
(A) Ethanol consumption causes increased cytochrome P450 2E1 (CYP2E1), NADPH oxidase (NOX) and inducible nitric oxide synthase (iNOS) via kupffer cell activation as well increased oxygen (O2) consumption thereby decreasing the O2 gradient within the liver leading to hypoxic regions, specifically the central lobular region. CYP2E1 and hypoxia causes increases in ROS production such as superoxide (O2·−) which inhibits mitochondrial respiration directly and through the production of peroxynitrite (ONOO). Hypoxic signaling has been reported to be increased by ONOO- through mechanisms which are still unclear (B) At higher O2 tensions, in normal liver, the lower basal activity of CcOX results in less inhibition and ˙NO is metabolized. In response to ethanol the levels of ˙NO increase and the higher metabolic turnover of the enzyme increases the susceptibility of cytochrome c oxidase (CcOX) to inhibition by ˙NO. In addition at the lower O2 tensions caused by alcohol exposure to the hepatocyte, more ˙NO is available to able to bind to CcOX. The inhibition of electron flow results in increased production of superoxide at other sites in the respiratory chain and through damage mediated by RNS results in amplification of the bioenergetic deficit.

References

    1. Hill BG, Dranka BP, Bailey S, Lancaster J, Darley-Usmar V. What part of NO don't you understand? Some answers to the cardinal questions in nitric oxide biology. J Biol Chem - PMC - PubMed
    1. Erusalimsky JD, Moncada S. Nitric oxide and mitochondrial signaling: from physiology to pathophysiology. Arterioscler Thromb Vasc Biol. 2007;27:2524–2531. - PubMed
    1. Mateo J, Garcia-Lecea M, Cadenas S, Hernandez C, Moncada S. Regulation of hypoxia-inducible factor-1alpha by nitric oxide through mitochondria-dependent and -independent pathways. Biochem J. 2003;376:537–544. - PMC - PubMed
    1. Moncada S, Higgs EA. The discovery of nitric oxide and its role in vascular biology. Br J Pharmacol. 2006;147(1):S193–201. - PMC - PubMed
    1. Xu W, Charles IG, Moncada S. Nitric oxide: orchestrating hypoxia regulation through mitochondrial respiration and the endoplasmic reticulum stress response. Cell Res. 2005;15:63–65. - PubMed

Publication types

MeSH terms

LinkOut - more resources