

Lipid body formation during maturation of human mast cells
- PMID: 21971714
- PMCID: PMC3220288
- DOI: 10.1194/jlr.M019737
Lipid body formation during maturation of human mast cells
Abstract
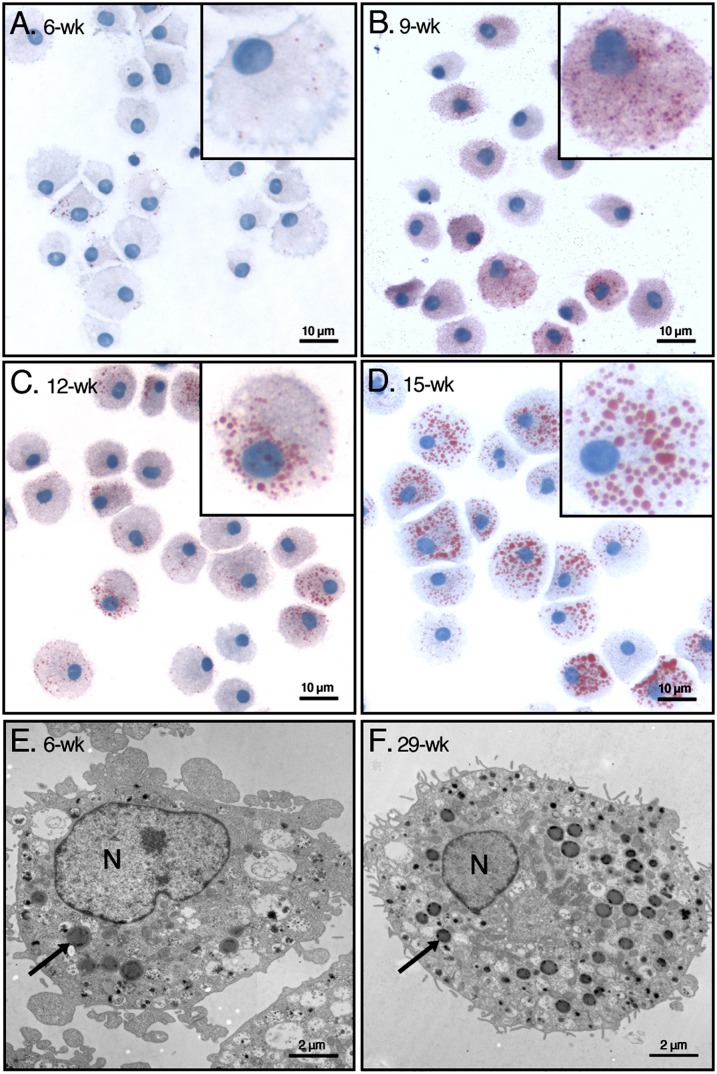
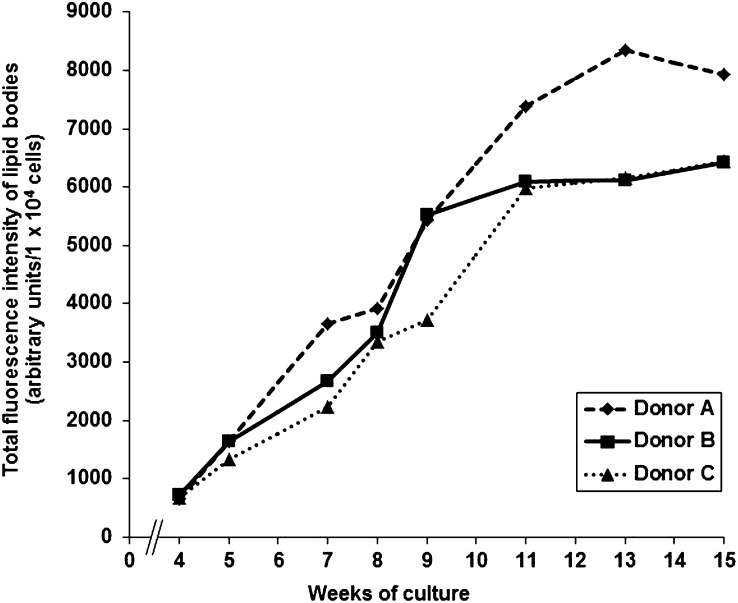
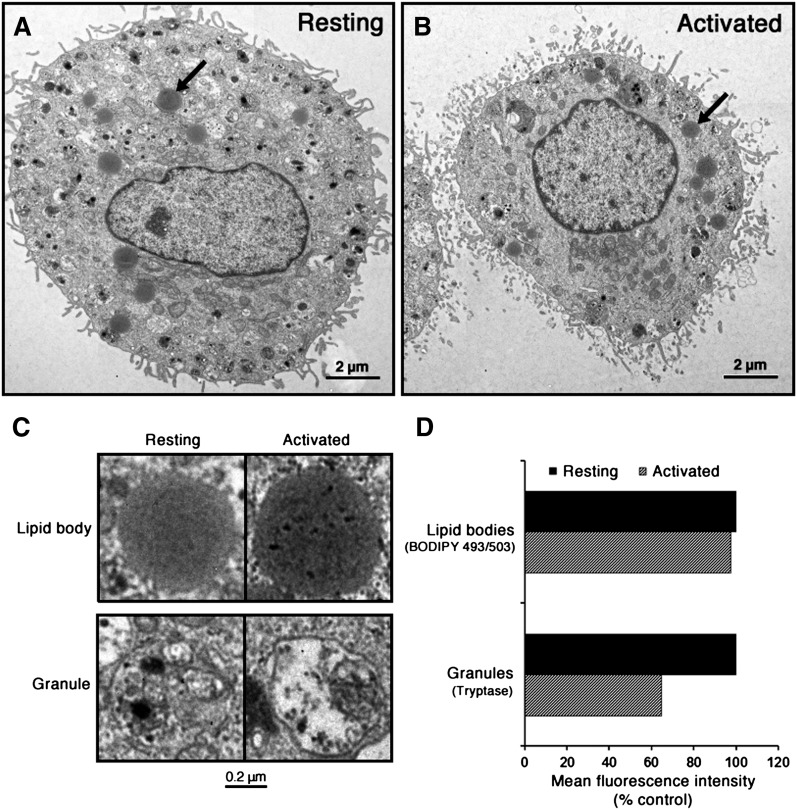
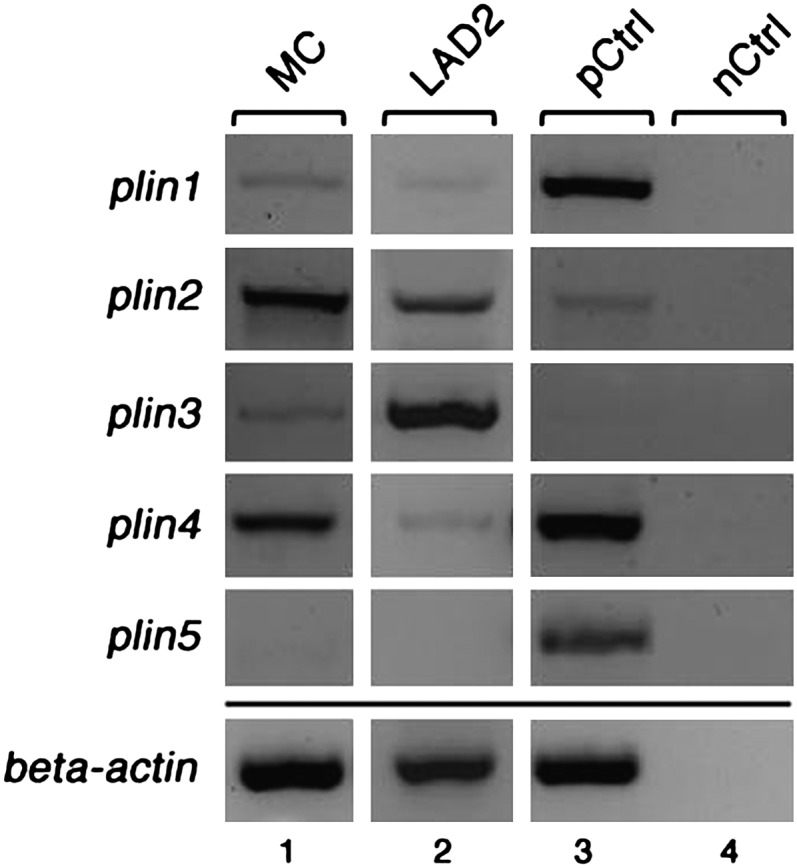
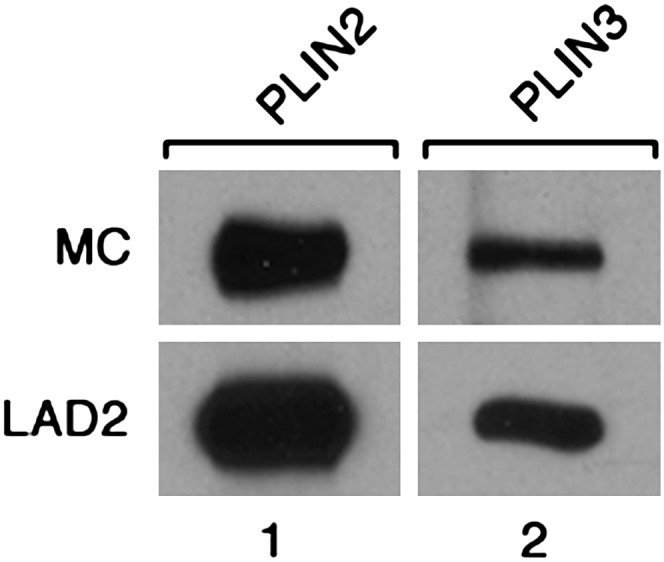
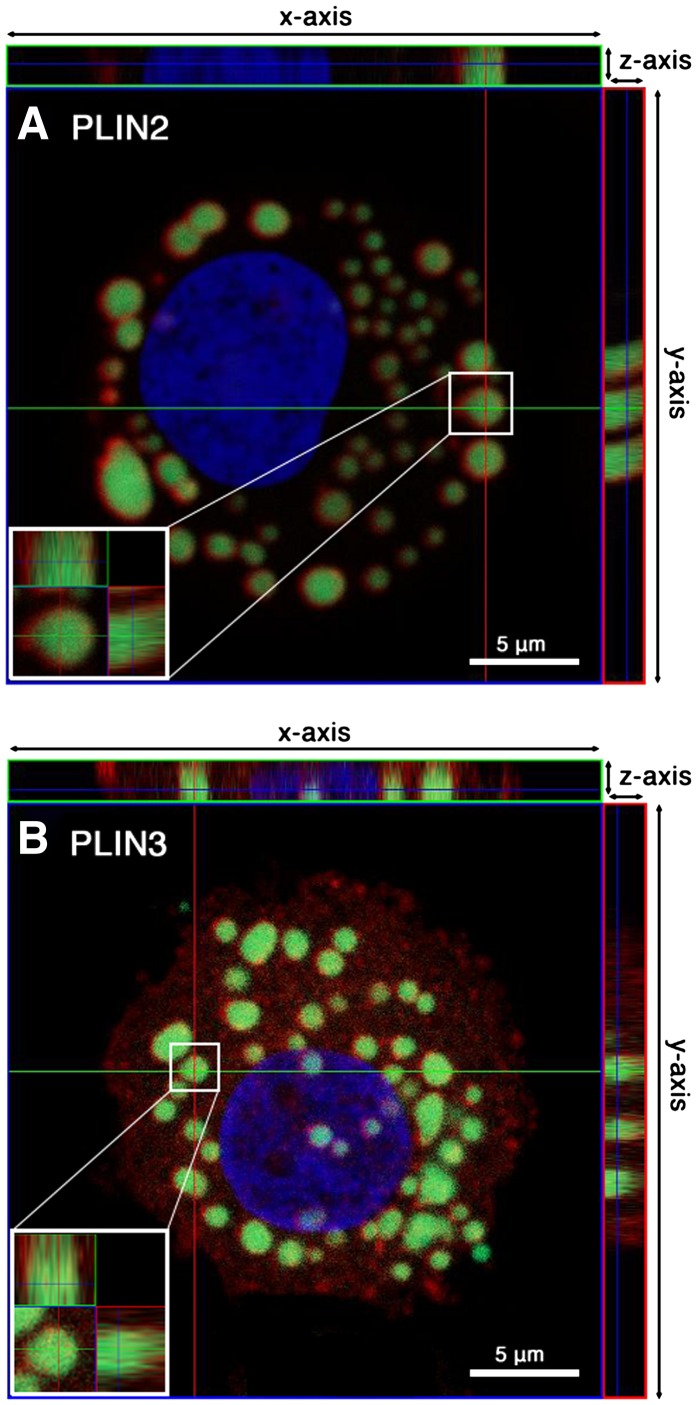
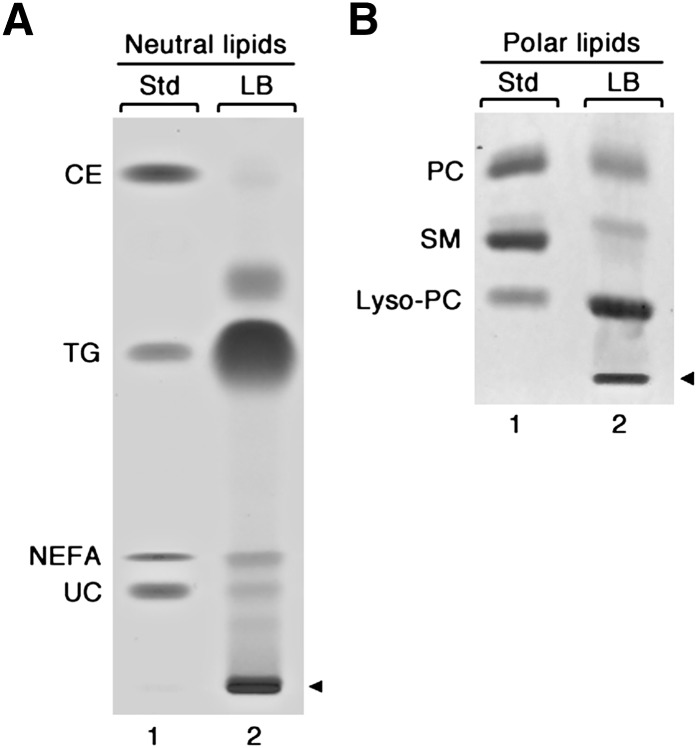
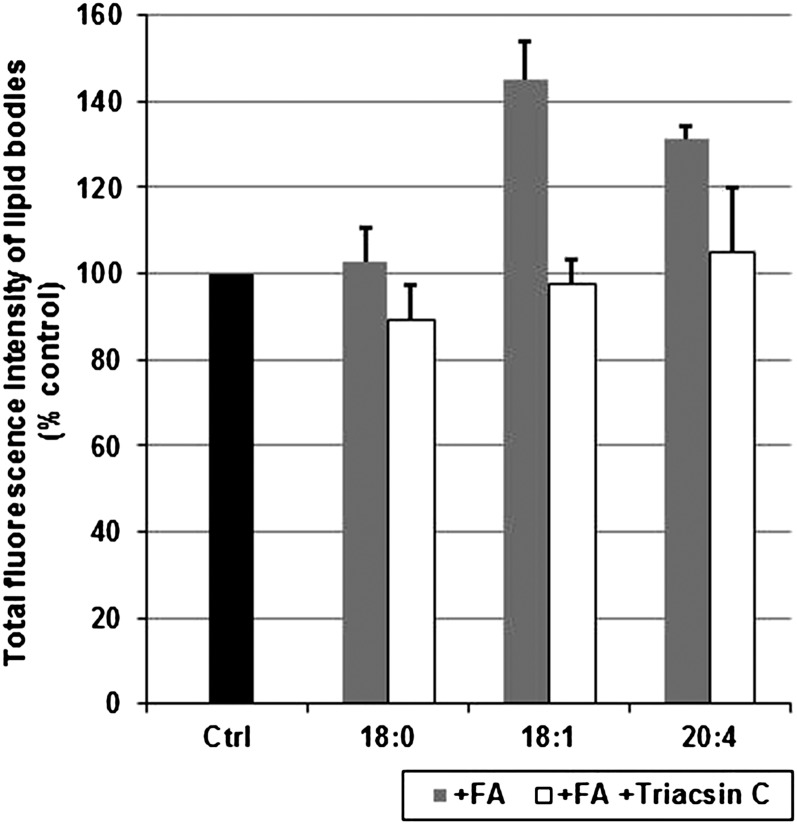
Lipid droplets, also called lipid bodies (LB) in inflammatory cells, are important cytoplasmic organelles. However, little is known about the molecular characteristics and functions of LBs in human mast cells (MC). Here, we have analyzed the genesis and components of LBs during differentiation of human peripheral blood-derived CD34(+) progenitors into connective tissue-type MCs. In our serum-free culture system, the maturing MCs, derived from 18 different donors, invariably developed triacylglycerol (TG)-rich LBs. Not known heretofore, the MCs transcribe the genes for perilipins (PLIN)1-4, but not PLIN5, and PLIN2 and PLIN3 display different degrees of LB association. Upon MC activation and ensuing degranulation, the LBs were not cosecreted with the cytoplasmic secretory granules. Exogenous arachidonic acid (AA) enhanced LB genesis in Triacsin C-sensitive fashion, and it was found to be preferentially incorporated into the TGs of LBs. The large TG-associated pool of AA in LBs likely is a major precursor for eicosanoid production by MCs. In summary, we demonstrate that cultured human MCs derived from CD34(+) progenitors in peripheral blood provide a new tool to study regulatory mechanisms involving LB functions, with particular emphasis on AA metabolism, eicosanoid biosynthesis, and subsequent release of proinflammatory lipid mediators from these cells.
Figures
Similar articles
-
Adipose triglyceride lipase regulates eicosanoid production in activated human mast cells.J Lipid Res. 2014 Dec;55(12):2471-8. doi: 10.1194/jlr.M048553. Epub 2014 Aug 11. J Lipid Res. 2014. PMID: 25114172 Free PMC article.
-
Perilipin family (PLIN) proteins in human skeletal muscle: the effect of sex, obesity, and endurance training.Appl Physiol Nutr Metab. 2012 Aug;37(4):724-35. doi: 10.1139/h2012-059. Epub 2012 Jun 5. Appl Physiol Nutr Metab. 2012. PMID: 22667335
-
Endocannabinoids limit excessive mast cell maturation and activation in human skin.J Allergy Clin Immunol. 2012 Mar;129(3):726-738.e8. doi: 10.1016/j.jaci.2011.11.009. Epub 2012 Jan 9. J Allergy Clin Immunol. 2012. PMID: 22226549
-
Lipid droplets in activated mast cells - a significant source of triglyceride-derived arachidonic acid for eicosanoid production.Eur J Pharmacol. 2016 Aug 15;785:59-69. doi: 10.1016/j.ejphar.2015.07.020. Epub 2015 Jul 9. Eur J Pharmacol. 2016. PMID: 26164793 Review.
-
Role of lipid droplet proteins in liver steatosis.J Physiol Biochem. 2011 Dec;67(4):629-36. doi: 10.1007/s13105-011-0110-6. Epub 2011 Aug 17. J Physiol Biochem. 2011. PMID: 21847662 Review.
Cited by
-
Comprehensive Proteomic Profiling of Converted Adipocyte-like Cells from Normal Human Dermal Fibroblasts Using Data-Independent Acquisition Mass Spectrometry.ACS Omega. 2024 Sep 9;9(38):40034-40050. doi: 10.1021/acsomega.4c05852. eCollection 2024 Sep 24. ACS Omega. 2024. PMID: 39346858 Free PMC article.
-
Lipid droplet functions beyond energy storage.Biochim Biophys Acta Mol Cell Biol Lipids. 2017 Oct;1862(10 Pt B):1260-1272. doi: 10.1016/j.bbalip.2017.07.006. Epub 2017 Jul 19. Biochim Biophys Acta Mol Cell Biol Lipids. 2017. PMID: 28735096 Free PMC article. Review.
-
Autophagy facilitates antibody-enhanced dengue virus infection in human pre-basophil/mast cells.PLoS One. 2014 Oct 16;9(10):e110655. doi: 10.1371/journal.pone.0110655. eCollection 2014. PLoS One. 2014. PMID: 25329914 Free PMC article.
-
Hepatic lipid droplets: A balancing act between energy storage and metabolic dysfunction in NAFLD.Mol Metab. 2021 Aug;50:101115. doi: 10.1016/j.molmet.2020.101115. Epub 2020 Nov 10. Mol Metab. 2021. PMID: 33186758 Free PMC article. Review.
-
Lipid droplets: a cellular organelle vital in cancer cells.Cell Death Discov. 2023 Jul 20;9(1):254. doi: 10.1038/s41420-023-01493-z. Cell Death Discov. 2023. PMID: 37474495 Free PMC article. Review.
References
-
- Murphy D. J. 2001. The biogenesis and functions of lipid bodies in animals, plants and microorganisms. Prog. Lipid Res. 40: 325–438. - PubMed
-
- Dvorak A. M., Dvorak H. F., Peters S. P., Shulman E. S., MacGlashan D. W., Jr, Pyne K., Harvey V. S., Galli S. J., Lichtenstein L. M. 1983. Lipid bodies: cytoplasmic organelles important to arachidonate metabolism in macrophages and mast cells. J. Immunol. 131: 2965–2976. - PubMed
-
- Moreira L. S., Piva B., Gentile L. B., Mesquita-Santos F. P., D'Avila H., Maya-Monteiro C. M., Bozza P. T., Bandeira-Melo C., Diaz B. L. 2009. Cytosolic phospholipase A2-driven PGE2 synthesis within unsaturated fatty acids-induced lipid bodies of epithelial cells. Biochim. Biophys. Acta. 1791: 156–165. - PubMed
Publication types
MeSH terms
Substances
Grants and funding
LinkOut - more resources
Full Text Sources
Medical
Research Materials
Miscellaneous
