

Storm in a coffee cup: caffeine modifies brain activation to social signals of threat
- PMID: 21972425
- PMCID: PMC3475358
- DOI: 10.1093/scan/nsr058
Storm in a coffee cup: caffeine modifies brain activation to social signals of threat
Abstract
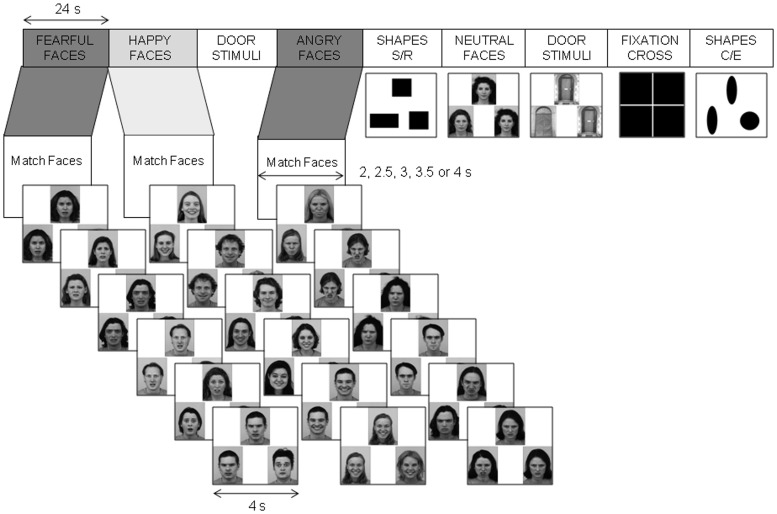
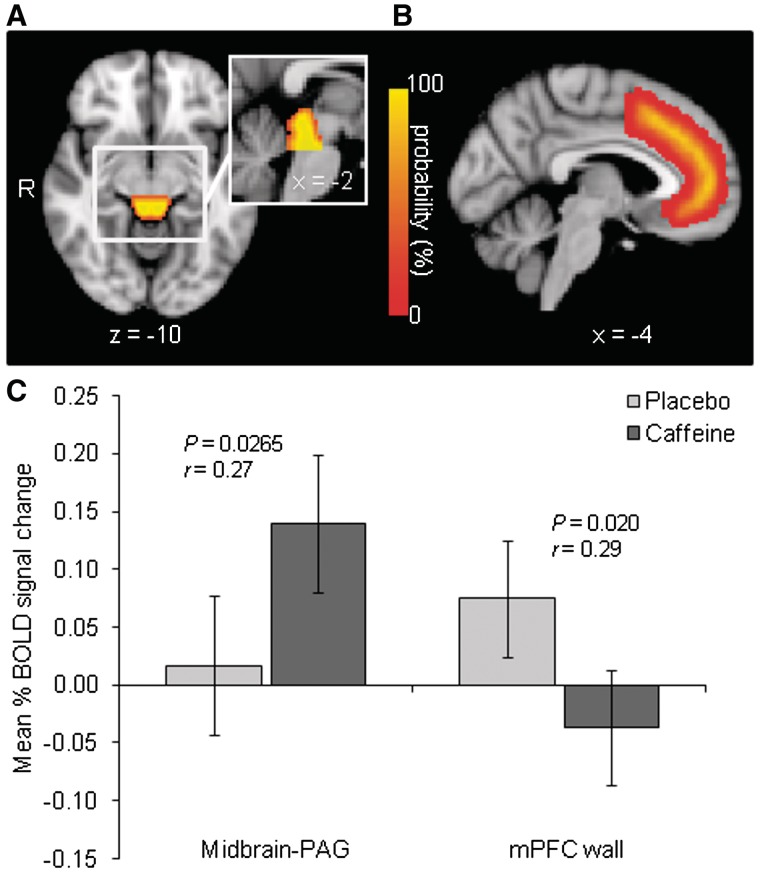
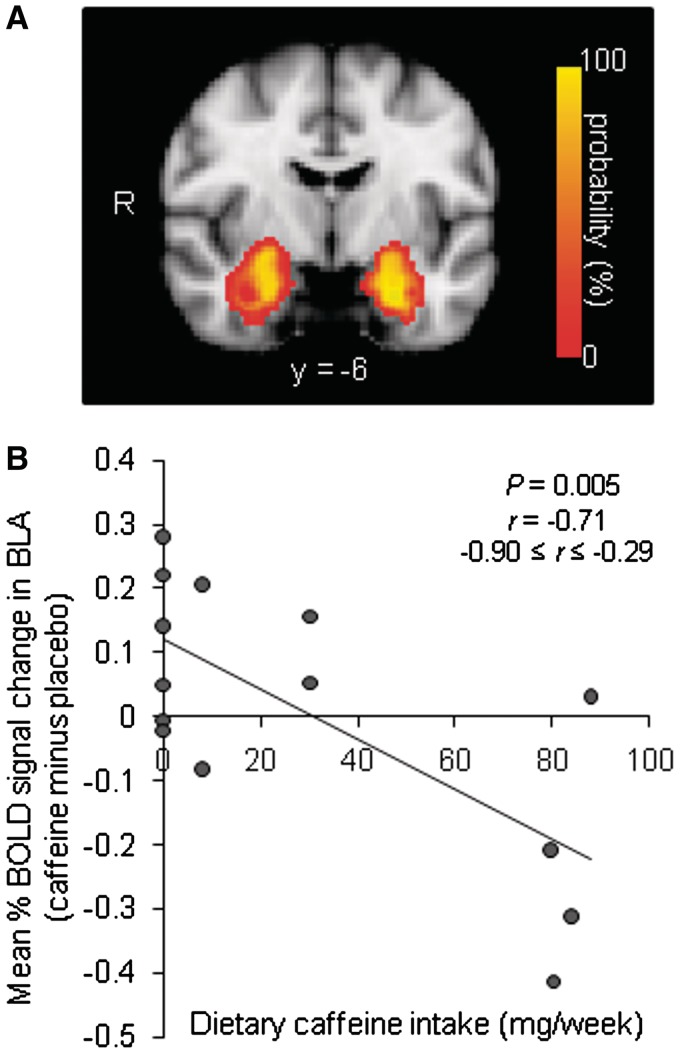
Caffeine, an adenosine A₁ and A(2A) receptor antagonist, is the most popular psychostimulant drug in the world, but it is also anxiogenic. The neural correlates of caffeine-induced anxiety are currently unknown. This study investigated the effects of caffeine on brain regions implicated in social threat processing and anxiety. Participants were 14 healthy male non/infrequent caffeine consumers. In a double-blind placebo-controlled crossover design, they underwent blood oxygenation level-dependent functional magnetic resonance imaging (fMRI) while performing an emotional face processing task 1 h after receiving caffeine (250 mg) or placebo in two fMRI sessions (counterbalanced, 1-week washout). They rated anxiety and mental alertness, and their blood pressure was measured, before and 2 h after treatment. Results showed that caffeine induced threat-related (angry/fearful faces > happy faces) midbrain-periaqueductal gray activation and abolished threat-related medial prefrontal cortex wall activation. Effects of caffeine on extent of threat-related amygdala activation correlated negatively with level of dietary caffeine intake. In concurrence with these changes in threat-related brain activation, caffeine increased self-rated anxiety and diastolic blood pressure. Caffeine did not affect primary visual cortex activation. These results are the first to demonstrate potential neural correlates of the anxiogenic effect of caffeine, and they implicate the amygdala as a key site for caffeine tolerance.
Figures
Similar articles
-
Neural predictors and mechanisms of cognitive behavioral therapy on threat processing in social anxiety disorder.Prog Neuropsychopharmacol Biol Psychiatry. 2013 Aug 1;45:83-91. doi: 10.1016/j.pnpbp.2013.05.004. Epub 2013 May 10. Prog Neuropsychopharmacol Biol Psychiatry. 2013. PMID: 23665375 Free PMC article. Clinical Trial.
-
Distinct effects of {delta}9-tetrahydrocannabinol and cannabidiol on neural activation during emotional processing.Arch Gen Psychiatry. 2009 Jan;66(1):95-105. doi: 10.1001/archgenpsychiatry.2008.519. Arch Gen Psychiatry. 2009. PMID: 19124693 Clinical Trial.
-
Oxytocin attenuates amygdala reactivity to fear in generalized social anxiety disorder.Neuropsychopharmacology. 2010 Nov;35(12):2403-13. doi: 10.1038/npp.2010.123. Epub 2010 Aug 18. Neuropsychopharmacology. 2010. PMID: 20720535 Free PMC article. Clinical Trial.
-
Antidepressant drug treatment modifies the neural processing of nonconscious threat cues.Biol Psychiatry. 2006 May 1;59(9):816-20. doi: 10.1016/j.biopsych.2005.10.015. Epub 2006 Feb 7. Biol Psychiatry. 2006. PMID: 16460693 Clinical Trial.
-
Functional atlas of emotional faces processing: a voxel-based meta-analysis of 105 functional magnetic resonance imaging studies.J Psychiatry Neurosci. 2009 Nov;34(6):418-32. J Psychiatry Neurosci. 2009. PMID: 19949718 Free PMC article. Review.
Cited by
-
Comprehensive machine learning assessment of zebrafish behaviour and biochemical markers in response to caffeine exposure.Ecotoxicology. 2025 Jul;34(5):746-759. doi: 10.1007/s10646-025-02873-0. Epub 2025 Mar 19. Ecotoxicology. 2025. PMID: 40108086 Free PMC article.
-
Subgenual Cingulum Microstructure Supports Control of Emotional Conflict.Cereb Cortex. 2016 Jun;26(6):2850-62. doi: 10.1093/cercor/bhw030. Epub 2016 Apr 5. Cereb Cortex. 2016. PMID: 27048427 Free PMC article.
-
Effects of Acute Drug Administration on Emotion: A Review of Pharmacological MRI Studies.Curr Addict Rep. 2021 Jun;8(2):181-193. doi: 10.1007/s40429-021-00362-y. Epub 2021 Mar 14. Curr Addict Rep. 2021. PMID: 34631363 Free PMC article.
-
Eat to Beat Stress.Am J Lifestyle Med. 2020 Dec 8;15(1):39-42. doi: 10.1177/1559827620973936. eCollection 2021 Jan-Feb. Am J Lifestyle Med. 2020. PMID: 33456419 Free PMC article.
-
Oxidative Stress Mediates Anxiety-Like Behavior Induced by High Caffeine Intake in Zebrafish: Protective Effect of Alpha-Tocopherol.Oxid Med Cell Longev. 2019 Oct 21;2019:8419810. doi: 10.1155/2019/8419810. eCollection 2019. Oxid Med Cell Longev. 2019. PMID: 31772712 Free PMC article.
References
-
- Alsene K, Deckert J, Sand P, de Wit H. Association between A2a receptor gene polymorphisms and caffeine-induced anxiety. Neuropsychopharmacology. 2003;28:1694–702. - PubMed
-
- Amunts K, Kedo O, Kindler M, et al. Cytoarchitectonic mapping of the human amygdala, hippocampal region and entorhinal cortex: intersubject variability and probability maps. Anatomy and Embryology. 2005;210:343–52. - PubMed
-
- An X, Bandler R, Öngür D, Price JL. Prefrontal cortical projections to longitudinal columns in the midbrain periaqueductal gray in macaque monkeys. Journal of Comparative Neurology. 1998;401:455–79. - PubMed
-
- Beckmann CF, Jenkinson M, Smith SM. General multilevel linear modelling for group analysis in FMRI. NeuroImage. 2003;20:1052–63. - PubMed
