

Ictal high-frequency oscillations at 80-200 Hz coupled with delta phase in epileptic spasms
- PMID: 21972918
- PMCID: PMC3674760
- DOI: 10.1111/j.1528-1167.2011.03263.x
Ictal high-frequency oscillations at 80-200 Hz coupled with delta phase in epileptic spasms
Abstract
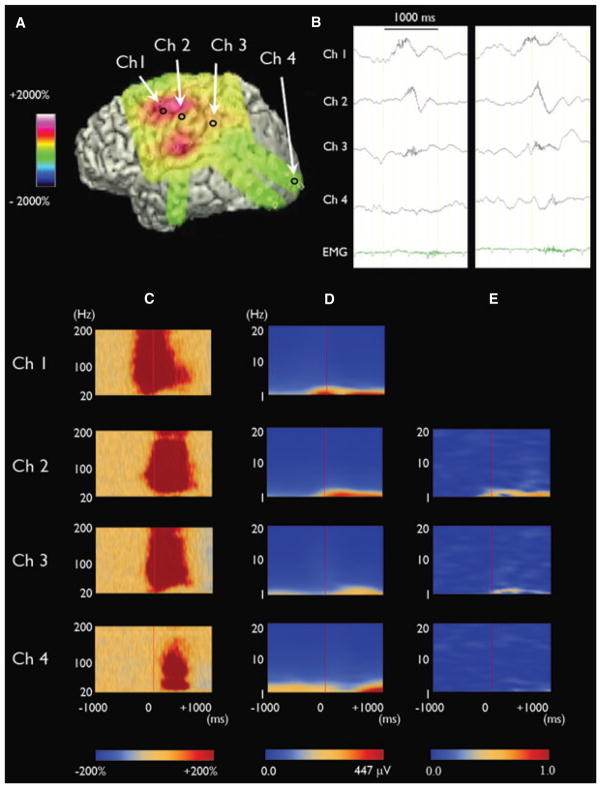
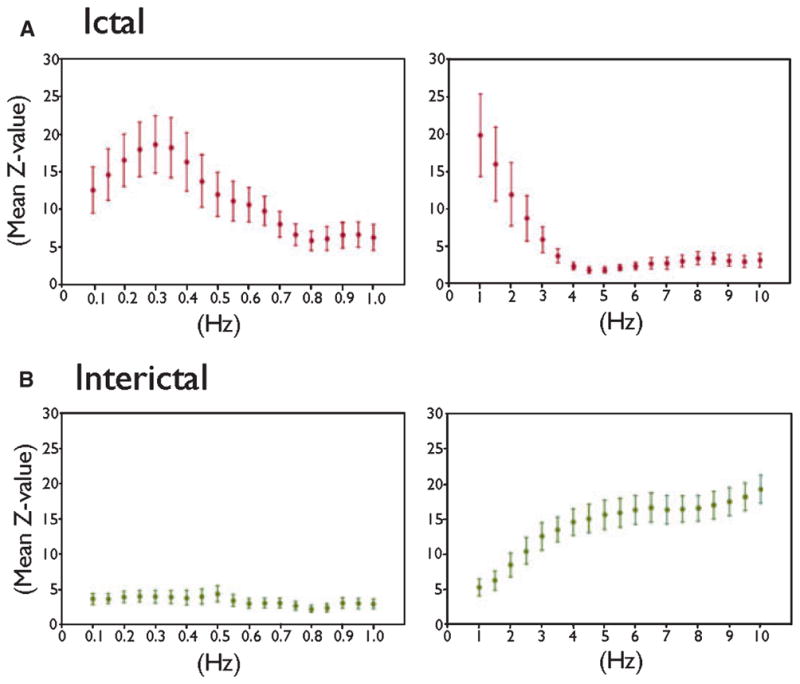
Previous studies of epileptic spasms reported that ictal events were associated with high-frequency oscillations (HFOs) or delta waves involving widespread regions. We determined whether ictal HFOs at 80-200 Hz were coupled with a phase of slow-wave, whether ictal slow-waves were diffusely or locally synchronous signals, and whether the mode of coupling between HFOs and slow-wave phases differed between ictal and interictal states. We studied 11 children who underwent extraoperative electrocorticography (ECoG) recording. The phases and amplitudes of slow-waves were measured at the peak of ictal and interictal HFOs in the seizure-onset sites. Ictal HFOs were locked tightly to the phase of slow-wave at ≤1 Hz. Ictal slow-waves propagated from the seizure-onset site to other regions. In contrast, interictal HFOs in the seizure-onset site were loosely locked to the phase of slow-wave at ≤1 Hz but tightly to that of ≥3-Hz. Ictal slow-waves coupled with HFOs can be explained as near-field and locally synchronized potentials generated by the neocortex rather than far-field potentials generated by subcortical structures. Ictal slow-waves in epileptic spasms may be generated by a mechanism different from what generates interictal HFOs-slow-wave complexes.
Wiley Periodicals, Inc. © 2011 International League Against Epilepsy.
Conflict of interest statement
None of the authors has any conflict of interest to disclose. We confirm that we have read the Journal’s position on issues involved in ethical publication and affirm that this report is consistent with those guidelines.
Figures
References
-
- Fusco L, Vigevano F. Ictal clinical electroencephalographic findings of spasms in West syndrome. Epilepsia. 1993;34:671–678. - PubMed
-
- Hoechstetter K, Bornfleth H, Weckesser D, Ille N, Berg P, Scherg M. BESA source coherence: a new method to study cortical oscillatory coupling. Brain Topogr. 2004;16:233–238. - PubMed
-
- Kakisaka Y, Haginoya K, Ishitobi M, Togashi N, Kitamura T, Wakusawa K, Sato I, Hino-Fukuyo N, Uematsu M, Munakata M, Yokoyama H, Iinuma K, Kaneta T, Higano S, Tsuchiya S. Utility of subtraction ictal SPECT images in detecting focal leading activity and understanding the pathophysiology of spasms in patients with West syndrome. Epilepsy Res. 2009;83:177–183. - PubMed
-
- Kellaway P, Hrachovy RA, Frost JD, Zion T. Precise characterization and quantification of infantile spasms. Ann Neurol. 1979;6:214–218. - PubMed
