

Slow-cycling therapy-resistant cancer cells
- PMID: 21973238
- PMCID: PMC3376467
- DOI: 10.1089/scd.2011.0477
Slow-cycling therapy-resistant cancer cells
Abstract
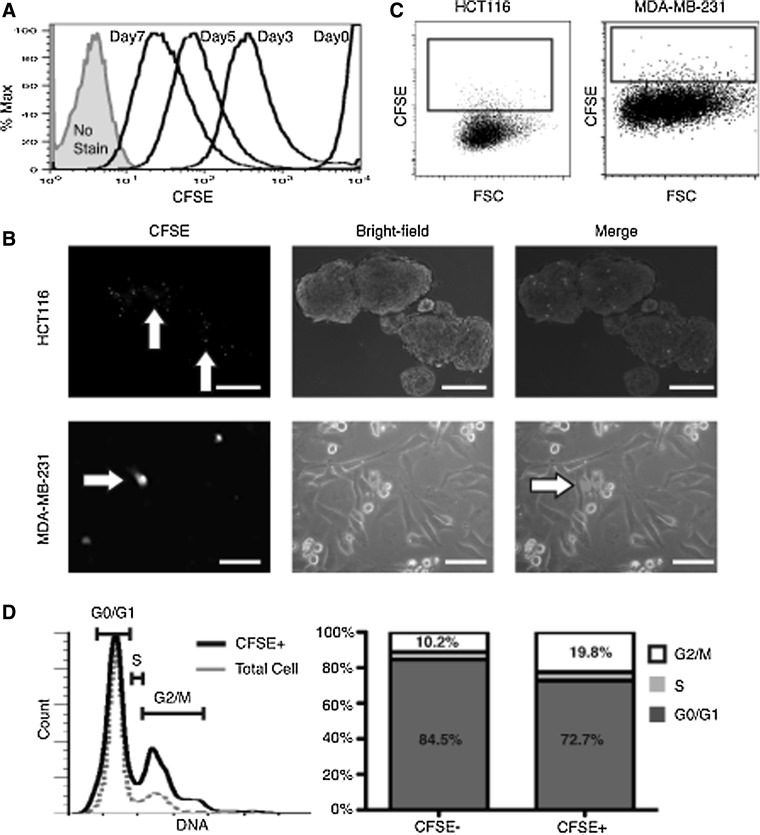
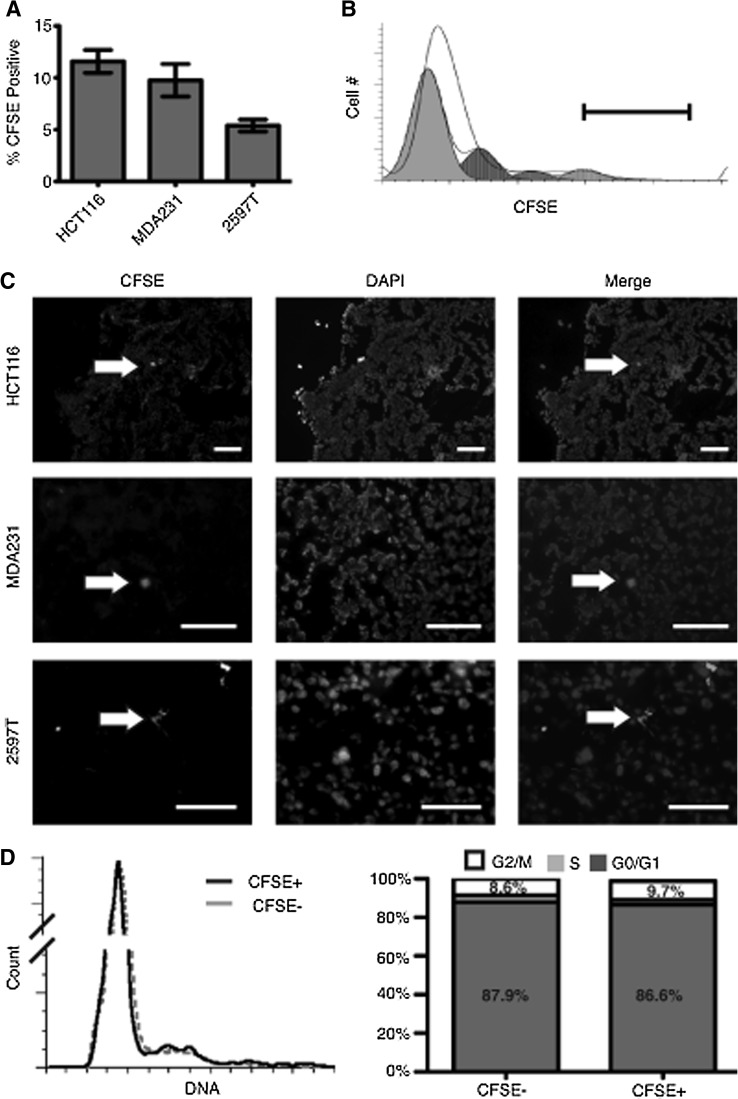
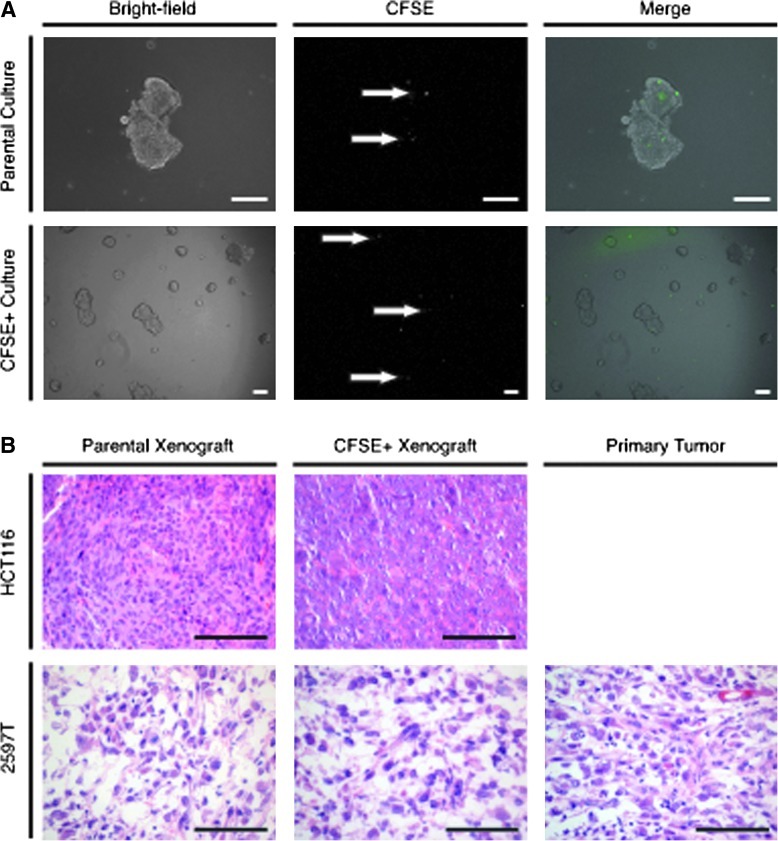
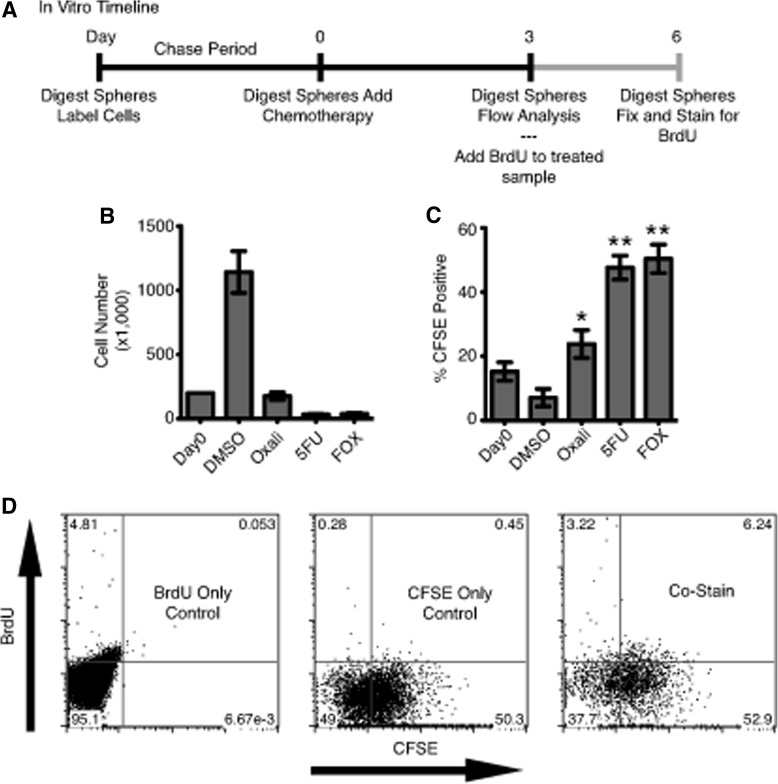
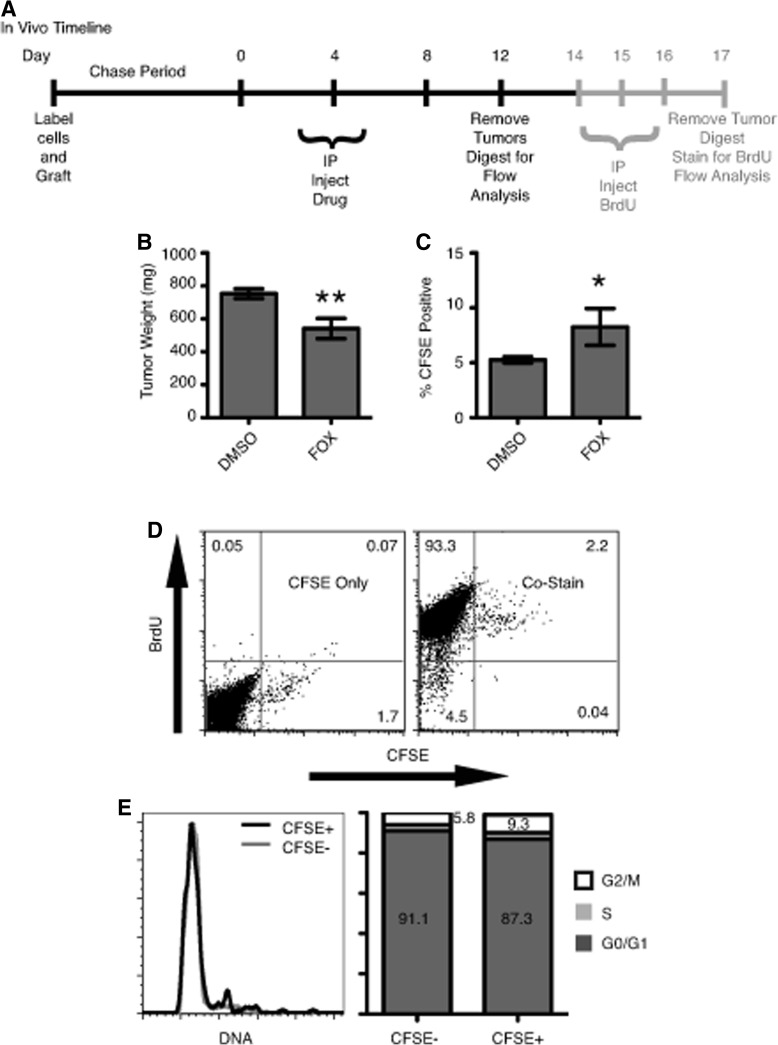
Tumor recurrence after chemotherapy is a major cause of patient morbidity and mortality. Recurrences are thought to be secondary to small subsets of cancer cells that are better able to survive traditional forms of chemotherapy and thus drive tumor regrowth. The ability to isolate and better characterize these therapy-resistant cells is critical for the future development of targeted therapies aimed at achieving more robust and long-lasting responses. Using a novel application for the proliferation marker carboxyfluorescein diacetate, succinimidyl ester (CFSE), we have identified a population of slow-cycling, label-retaining tumor cells in both in vitro sphere cultures and in vivo xenograft models. Strikingly, label-retaining cells exhibit a multifold increase in ability to survive traditional forms of chemotherapy and reenter the cell cycle. Further, we demonstrate the innovative application of CFSE to live sort slow-cycling tumor cells and validate their chemoresistance and tumorigenic potential.
Figures
Similar articles
-
The use of carboxyfluorescein diacetate succinimidyl ester (CFSE) to monitor lymphocyte proliferation.J Vis Exp. 2010 Oct 12;(44):2259. doi: 10.3791/2259. J Vis Exp. 2010. PMID: 20972413 Free PMC article.
-
Identification and isolation of slow-dividing cells in human glioblastoma using carboxy fluorescein succinimidyl ester (CFSE).J Vis Exp. 2012 Apr 29;(62):3918. doi: 10.3791/3918. J Vis Exp. 2012. PMID: 22565048 Free PMC article.
-
Quantifying lymphocyte kinetics in vivo using carboxyfluorescein diacetate succinimidyl ester (CFSE).Proc Biol Sci. 2006 May 7;273(1590):1165-71. doi: 10.1098/rspb.2005.3432. Proc Biol Sci. 2006. PMID: 16600897 Free PMC article.
-
Carboxyfluorescein diacetate succinimidyl ester and the virgin lymphocyte: a marriage made in heaven.Immunol Cell Biol. 1999 Dec;77(6):530-8. doi: 10.1046/j.1440-1711.1999.00871.x. Immunol Cell Biol. 1999. PMID: 10571674 Review.
-
Analysing cell division in vivo and in vitro using flow cytometric measurement of CFSE dye dilution.J Immunol Methods. 2000 Sep 21;243(1-2):147-54. doi: 10.1016/s0022-1759(00)00231-3. J Immunol Methods. 2000. PMID: 10986412 Review.
Cited by
-
Acetate drives ovarian cancer quiescence via ACSS2-mediated acetyl-CoA production.bioRxiv [Preprint]. 2024 Jul 14:2024.07.12.603313. doi: 10.1101/2024.07.12.603313. bioRxiv. 2024. Update in: Mol Metab. 2024 Nov;89:102031. doi: 10.1016/j.molmet.2024.102031. PMID: 39026889 Free PMC article. Updated. Preprint.
-
Infiltrative and drug-resistant slow-cycling cells support metabolic heterogeneity in glioblastoma.EMBO J. 2018 Dec 3;37(23):e98772. doi: 10.15252/embj.201798772. Epub 2018 Oct 15. EMBO J. 2018. PMID: 30322894 Free PMC article.
-
Microenvironment-Driven Dynamic Heterogeneity and Phenotypic Plasticity as a Mechanism of Melanoma Therapy Resistance.Front Oncol. 2018 May 24;8:173. doi: 10.3389/fonc.2018.00173. eCollection 2018. Front Oncol. 2018. PMID: 29881716 Free PMC article. Review.
-
Differential Sensitivities of Fast- and Slow-Cycling Cancer Cells to Inosine Monophosphate Dehydrogenase 2 Inhibition by Mycophenolic Acid.Mol Med. 2016 Jan;21(1):792-802. doi: 10.2119/molmed.2015.00126. Epub 2015 Oct 13. Mol Med. 2016. PMID: 26467706 Free PMC article.
-
Glioma Stem-Like Cells and Metabolism: Potential for Novel Therapeutic Strategies.Front Oncol. 2021 Aug 31;11:743814. doi: 10.3389/fonc.2021.743814. eCollection 2021. Front Oncol. 2021. PMID: 34532295 Free PMC article. Review.
References
-
- Andre T. Boni C. Navarro M. Tabernero J. Hickish T. Topham C. Bonetti A. Clingan P. Bridgewater J. Rivera F. de Gramont A. Improved overall survival with oxaliplatin, fluorouracil, and leucovorin as adjuvant treatment in stage II or III colon cancer in the MOSAIC trial. J Clin Oncol. 2009;27:3109–3116. - PubMed
-
- Bao S. Wu Q. McLendon RE. Hao Y. Shi Q. Hjelmeland AB. Dewhirst MW. Bigner DD. Rich JN. Glioma stem cells promote radioresistance by preferential activation of the DNA damage response. Nature. 2006;444:756–760. - PubMed
-
- Jung Y. Lippard SJ. Direct cellular responses to platinum-induced DNA damage. Chem Rev. 2007;107:1387–1407. - PubMed
-
- Papamichael D. The use of thymidylate synthase inhibitors in the treatment of advanced colorectal cancer: current status. Oncologist. 1999;4:478–487. - PubMed
Publication types
MeSH terms
Substances
Grants and funding
LinkOut - more resources
Full Text Sources
Other Literature Sources