. 2011 Oct;130(4):1888-98.
doi: 10.1121/1.3625239.

Cavitation clouds created by shock scattering from bubbles during histotripsy

Affiliations

Cavitation clouds created by shock scattering from bubbles during histotripsy

Adam D Maxwell et al. J Acoust Soc Am. 2011 Oct.

Abstract

Histotripsy is a therapy that focuses short-duration, high-amplitude pulses of ultrasound to incite a localized cavitation cloud that mechanically breaks down tissue. To investigate the mechanism of cloud formation, high-speed photography was used to observe clouds generated during single histotripsy pulses. Pulses of 5-20 cycles duration were applied to a transparent tissue phantom by a 1-MHz spherically focused transducer. Clouds initiated from single cavitation bubbles that formed during the initial cycles of the pulse, and grew along the acoustic axis opposite the propagation direction. Based on these observations, we hypothesized that clouds form as a result of large negative pressure generated by the backscattering of shockwaves from a single bubble. The positive-pressure phase of the wave inverts upon scattering and superimposes on the incident negative-pressure phase to create this negative pressure and cavitation. The process repeats with each cycle of the incident wave, and the bubble cloud elongates toward the transducer. Finite-amplitude propagation distorts the incident wave such that the peak-positive pressure is much greater than the peak-negative pressure, which exaggerates the effect. The hypothesis was tested with two modified incident waves that maintained negative pressure but reduced the positive pressure amplitude. These waves suppressed cloud formation which supported the hypothesis.


Figures

Figure 1
Figure 1
Apparatus for high-speed imaging of histotripsy bubble clouds. A fiber-coupled flash lamp was used to back-illuminate images captured by the camera. An ultrasound transducer placed in the water tank was focused into a gelatin-based tissue-mimicking phantom. The transducer was driven by a class D amplifier with matching circuit. A function generator was used to control the amplifier output and trigger the camera, which in turn triggered the flash lamp.
Figure 2
Figure 2
A 3-cycle focal pressure waveform of the histotripsy transducer used to generate bubble clouds. The waveforms are asymmetric with a larger positive-pressure excursion than negative-pressure excursion as a result of nonlinear acoustic propagation and diffraction. Pulse lengths of 5–20 cycles were used in this study for generating clouds.
Figure 3
Figure 3
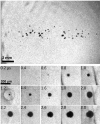
Single bubbles generated at the focus of a histotripsy transducer (top) and temporal behavior of an individual bubble during the first three cycles of a pulse (bottom). Ultrasound propagation was from left to right. Bubbles appeared in the initial cycles of the pulse, and underwent inertial collapse (an emitted shockwave is visible at t = 1.2 μs). However, bubbles did not continue to collapse during the later cycles, but instead deformed. Note, there is some small difference in the appearance and position of the shocks (dark lines) at t = 1.0, 2.0, and 3.0 μs due to transducer ring up and camera spatial jitter.
Figure 4
Figure 4
Growth of a bubble cloud at the focus during application of a 20-cycle pulse. Ultrasound propagation was from left to right. The cloud started from a distal location within the focal zone and grew toward the transducer along the acoustic axis. The dark lines in each frame are a shadowgraph pattern created by the shock fronts of each cycle of the wave.
Figure 5
Figure 5
Plot of measured cloud dimensions vs time for the photographic sequence in Fig. 4. The cloud started to grow between t = 2 and 4 μs. The time when the final acoustic cycle passed the proximal end of the cloud (t = 16 μs) coincided with termination of cloud growth along the acoustic axis.
Figure 6
Figure 6
(Top) Typical size and shape of bubble clouds formed during 5, 10, 15, and 20 cycle pulses at 1 MHz. Ultrasound propagation was from left to right. All images have been aligned spatially relative to the focus. Note the widths of bubble clouds were similar, but the length increased with cycle number. (Bottom) Cloud dimensions vs pulse length. The axial length of the cloud increased as the pulse length increased, but lateral size remained about the same.
Figure 7
Figure 7
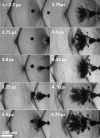
Initiation of a bubble cloud. Ultrasound propagation was from left to right. At t = 2.5 μs, a single bubble was present at the right side of the frame. After the shock impinged on the bubble (t = 2.75 μs), a spherical wave was visible, apparently scattered by the bubble. Over the next cycle, a cloud of bubbles stemmed from the center of the single bubble behind this scattered wave. A second cycle produced another section of the cloud between t = 3.5 μs and t = 4.0 μs, and a third section was produced between t = 4.25 μs and t = 4.75 μs. The timing in this figure corresponded to that in Fig. 2 with the waveform at the position of the initial bubble.
Figure 8
Figure 8
Conceptual sketch of shock scattering from a bubble (top) and pressure distribution on the acoustic axis (bottom). The incident wave (shown here as a plane wave for simplicity) travels from left to right. During the initial negative phases of the pulse, single bubbles expand in response (frame 1). As a shock impinges on the bubble, the wave is scattered (frame 2). This backscattered shock constructively interferes with the incident wave to create a large transient rarefaction (frame 3). This wave induces further cavitation behind the bubble (frame 4). The next shock then scatters from this new bubble cluster, and the process repeats.
Figure 9
Figure 9
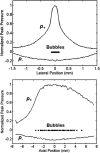
Positions of bubbles (black dots, n = 35) for cloud initiation, as well as peak positive (p+) and negative pressure (p) distribution at the focus. (Top) Lateral profile of focus and initiation bubble positions. Note bubble clouds were only formed by bubbles +∕− 118 μm from the center of the focus. The measured width of the −3 dB positive pressure zone at this location was 270 μm. (Bottom) Axial profile of focus and initiating bubble positions.
Figure 10
Figure 10
Fraction of pulses that produced bubble clouds vs acoustic pressure for two different transducers with same frequency and focal length, but different F number. The upper two graphs show the bubble cloud formation probability in degassed, filtered water (n = 50, margin of error = 1n = 0.14) and the lower two graphs show the bubble cloud formation probability in gelatin (n = 35, margin of error = 0.17). Dashed lines are S-curves defined by a cumulative distribution function for a normal distribution, fit by nonlinear least squares analysis to the data.
Figure 11
Figure 11
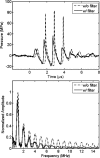
Comparison of the temporal waveforms (top) and frequency spectra (bottom) with and without the acoustic filter placed between the focus and transducer. The positive pressure was lowered with the filter, while the negative pressure remained the same after increasing the transducer drive voltage. In the frequency domain, the fundamental and second harmonics had nearly the same amplitude as the original signal, but higher harmonics were greatly reduced.

References

    1. Zhu S., Cocks F. H., Preminger G. M., and Zhong P., “The role of stress waves and cavitation in stone comminution in shock wave lithotripsy,” Ultrasound Med. Biol. 28, 661–671 (2002). 10.1016/S0301-5629(02)00506-9 - DOI - PubMed
    1. Pishchalnikov Y. A., Sapozhnikov O. A., Bailey M. R., Williams J. C., Cleveland R. O., Colonius T., Crum L. A., Evan A. P., and McAteer J. A., “Cavitation bubble cluster activity in the breakage of kidney stones by lithotripter shockwaves,” J. Endourol. 17, 435–446 (2003). 10.1089/089277903769013568 - DOI - PMC - PubMed
    1. Zhu S., Dreyer T., Liebler M., Riedlinger R., Preminger G. M., and Zhong P., “Reduction of tissue injury in shock-wave lithotripsy by using an acoustic diode,” Ultrasound Med. Biol. 30, 675–682 (2004). 10.1016/j.ultrasmedbio.2004.03.008 - DOI - PubMed
    1. Matlaga B. R., McAteer J. A., Connors B. A., Handa R. K., Evan A. P., Williams J. C., Lingeman J. E., and Willis L. R., “Potential for cavitation-mediated tissue damage in shockwave lithotripsy,” J. Endourol. 22, 121–126 (2008). 10.1089/end.2007.9852 - DOI - PubMed
    1. Evan A. P., Willis L. R., McAteer J. A., Bailey M. R., Connors B. A., Shao Y., Lingeman J. E., Williams J. C., Fineberg N. S., and Crum L. A., “Kidney damage and renal functional changes are minimized by waveform control that suppresses cavitation in shock wave lithotripsy,” J. Urol. 168, 1556–1562 (2002). 10.1016/S0022-5347(05)64520-X - DOI - PubMed

Publication types