

Prevalence of hypertension in 9- to 10-year-old Icelandic school children
- PMID: 21974766
- PMCID: PMC8108873
- DOI: 10.1111/j.1751-7176.2011.00496.x
Prevalence of hypertension in 9- to 10-year-old Icelandic school children
Abstract
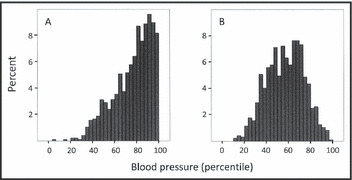
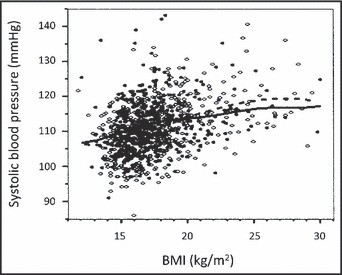
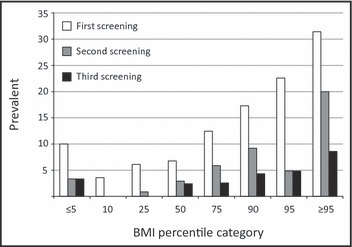
The purpose of the study was to investigate blood pressure (BP) distribution, prevalence of hypertension, and correlation between BP and body mass index (BMI) in 9- to 10-year-old Icelandic children. Two manual and two automated BP measurements were performed in 1071 Icelandic children. Children with elevated BP underwent a second BP screening, and a third screening was performed if the BP was elevated at the second visit. Hypertension was defined as BP ≥95th percentile at all three visits. White-coat hypertension was diagnosed in hypertensive children with normal 24-hour ambulatory BP. Of 970 children with complete data, 489 were girls (50.4%). The mean BP was 111/63 mm Hg in girls and 112/64 mm Hg in boys (P<.001). The prevalence of elevated BP was 13.1%, 6.0%, and 3.1% after the first, second, and third screen, respectively. The prevalence of sustained hypertension was 2.5% and an additional 0.6% had white-coat hypertension. A significant correlation between BMI and BP was observed (r=0.338, P<.001) and 8.6% of the obese children had hypertension. The prevalence of hypertension in 9- to 10-year-old Icelandic children is lower than indicated in recent reports and is associated with obesity.
© 2011 Wiley Periodicals, Inc.
Figures
References
-
- Din‐Dzietham R, Liu Y, Bielo MV, et al. High blood pressure trends in children and adolescents in national surveys, 1963 to 2002. Circulation. 2007;116:1488–1496. - PubMed
-
- Falkner B. What exactly do the trends mean? Circulation. 2007;116:1437–1439. - PubMed
-
- Sorof JM, Lai D, Turner J, et al. Overweight, ethnicity, and the prevalence of hypertension in school‐aged children. Pediatrics. 2004;113:475–482. - PubMed
-
- Fixler DE, Laird WP, Fitzgerald V, et al. Hypertension screening in schools: results of the Dallas study. Pediatrics. 1979;63:32–36. - PubMed
-
- Lauer RM, Connor WE, Leaverton PE, et al. Coronary heart disease risk factors in school children: the Muscatine study. J Pediatr. 1975;86:697–706. - PubMed
Publication types
MeSH terms
LinkOut - more resources
Full Text Sources
Medical
