. 2012 Jan;245(1):100-8.
doi: 10.1111/j.1365-2818.2011.03555.x. Epub 2011 Oct 4.

Long-term monitoring of live cell proliferation in presence of PVP-Hypericin: a new strategy using ms pulses of LED and the fluorescent dye CFSE

Affiliations

Long-term monitoring of live cell proliferation in presence of PVP-Hypericin: a new strategy using ms pulses of LED and the fluorescent dye CFSE

Rozhin Penjweini et al. J Microsc. 2012 Jan.

Abstract

During fluorescent live cell imaging it is critical to keep excitation light dose as low as possible, especially in the presence of photosensitizer drugs, which generate free radicals upon photobleaching. During fluorescent imaging, stress by excitation and free radicals induces serious cell damages that may arrest the cell cycle. This limits the usefulness of the technique for drug discovery, when prolonged live cell imaging is necessary. This paper presents a strategy to provide gentle experimental conditions for dynamic monitoring of the proliferation of human lung epithelial carcinoma cells (A549) in the presence of the photosensitizer Polyvinylpyrrolidone-Hypericin. The distinctive strategy of this paper is based on the stringent environmental control and optimizing the excitation light dose by (i) using a low-power pulsed blue light-emitting diode with short pulse duration of 1.29 ms and (ii) adding a nontoxic fluorescent dye called carboxyfluorescein-diacetate-succinimidyl-ester (CFSE) to improve the fluorescence signals. To demonstrate the usefulness of the strategy, fluorescence signals and proliferation of dual-marked cells, during 5-h fluorescence imaging under pulsed excitation, were compared with those kept under continuous excitation and nonmarked reference cells. The results demonstrated 3% cell division and 2% apoptosis due to pulsed excitation compared to no division and 85% apoptosis under the continuous irradiation. Therefore, our strategy allows live cell imaging to be performed over longer time scales than with conventional continuous excitation.


Figures

Fig. 1
Fig. 1
Schematic diagram of imaging setup that has been modified to include a low power blue LED as an excitation light source and a chamber for preparing a controlled cellular environment. The halogen lamp was only used for imaging of reference cells.
Fig. 2
Fig. 2
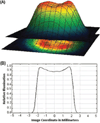
The semi-flattened Gaussian distribution of LED beam in the focal plane of the objective lens. (A) Three-dimensional profile of the blue LED beam (spot diameter of about 3.8mm)on the focal plane. (B) The intensity-mapped representation of the focused beam designed by ZEMAX and Wolfram Mathematica 7.0 software.
Fig. 3
Fig. 3
Spectral analysis of the dual-marked A549 cells with CFSE and PVP-Hypericin. The black solid line shows the absorbance spectrum, and the grey dashed line indicates the fluorescence emission spectrum at 488 nm excitation wavelength. The broad fluorescence emission spectra of CFSE (around 517 nm) and of PVP-Hypericin (around 596 nm) exhibit considerable overlap in the grey area.
Fig. 4
Fig. 4
Eight-hour monitoring of proliferation of nonmarked A549 cells (reference cells) The images were collected with a 20× objective (air for phase contrast) under a halogen lamp. The white scale bars represent 50 µm. Incidentally, nonmarked cells have no auto-fluorescence under pulsed or continuous blue irradiation.
Fig. 5
Fig. 5
An 8-h imaging of A549 cells expressing CFSE green fluorescence. Images were collected with a 20× objective (air for phase contrast). (A) Fluorescence signals and cell proliferation under continuous blue excitation. (B) Fluorescence signals and cell proliferation under pulsed blue excitation. The white scale bars represent 50 µm.
Fig. 6
Fig. 6
Comparison between the percentages of division and apoptosis in marked cells with CFSE under blue-LED excitation with nonmarked reference cells under the halogen lamp, during 8-h imaging. The experiments were repeated three times, and for each measurement the cell number was counted thrice. Error bars represent the standard deviation.
Fig. 7
Fig. 7
A5-h imaging of the dual-marked A549 cells with CFSE and PVP-Hypericin. Images were collected with a 20× objective (air for phase contrast). (A) Fluorescence signals and cell proliferation under continuous blue excitation. (B) Fluorescence signals and cell proliferation under pulsed blue excitation. The scale bars represent 50 µm.
Fig. 8
Fig. 8
(A) Monitoring of apoptotic and divided A549 cells, dual-marked with CFSE and PVP-Hypericin, under continuous and pulsed excitation. Cells excited with continuous blue LED round up (yellow arrows) and after 120 min most cells are apoptotic (pink arrows). By applying pulsed blue LED the photodamages are delayed and even dynamic monitoring of cell division (blue arrows) is possible. (B) Comparison of the percentages of division and apoptosis in dual-marked cells under blue-LED excitation with nonmarked reference cells under the halogen lamp, during 5-h imaging. Error bars represent the standard deviation. The scale bars represent 10 µm.

Similar articles

Cited by

References

    1. Borlinghaus RT. MRT letter: high speed scanning has the potential to increase fluorescence yield and to reduce photobleaching. Microsc. Res. Tech. 2006;69:689–692. - PubMed
    1. Bovik AC. Handbook of Image and Video Processing. 2nd ed. New York: Elsevier Academic Press; 2005.
    1. Connally RE, Piper JA. Time-gated luminescence microscopy. Ann N.Y. Acad Sci. 2008;1130:106–116. - PubMed
    1. Frigault MM, Lacoste J, Swift JL, Brown CM. Live-cell microscopy: tips and tools. J. Cell Sci. 2009;122:753–767. - PubMed
    1. Goldman RD, Spector DL. Live Cell Imaging, a Laboratory Manual. New York: Cold Spring Harbor Laboratory; 2005. pp. 337–338.

Publication types