. 2011 Oct 5;3(103):103ra97.
doi: 10.1126/scitranslmed.3002627.

Increased gene dosage of Ube3a results in autism traits and decreased glutamate synaptic transmission in mice

Affiliations

Increased gene dosage of Ube3a results in autism traits and decreased glutamate synaptic transmission in mice

Stephen E P Smith et al. Sci Transl Med. .

Abstract

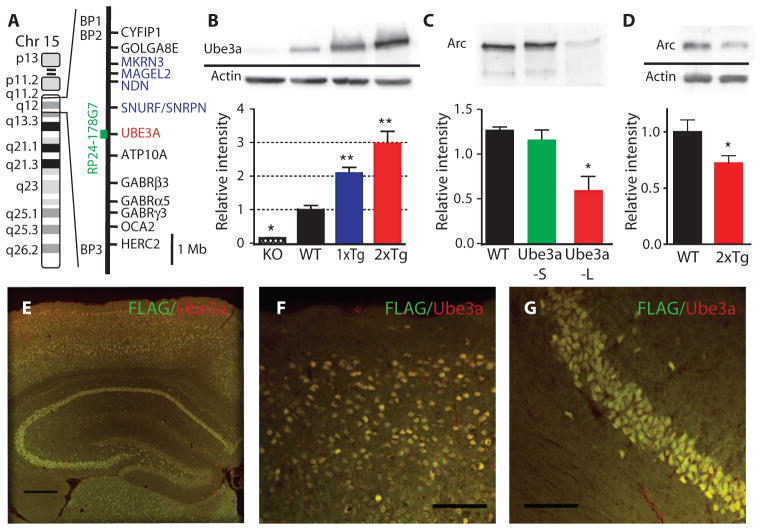
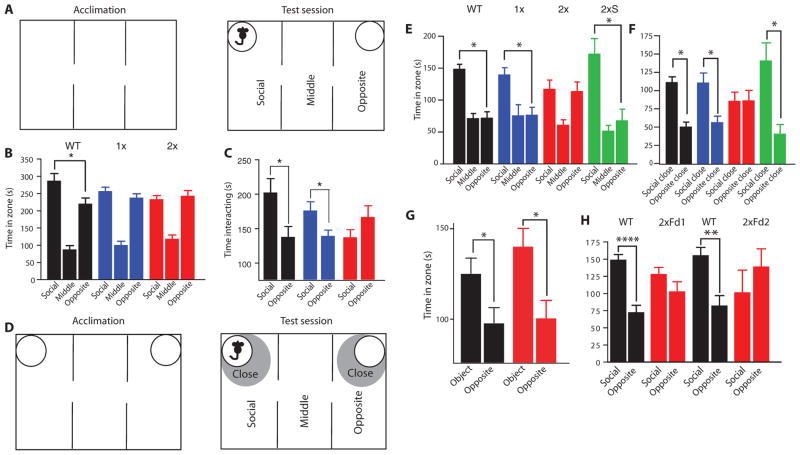
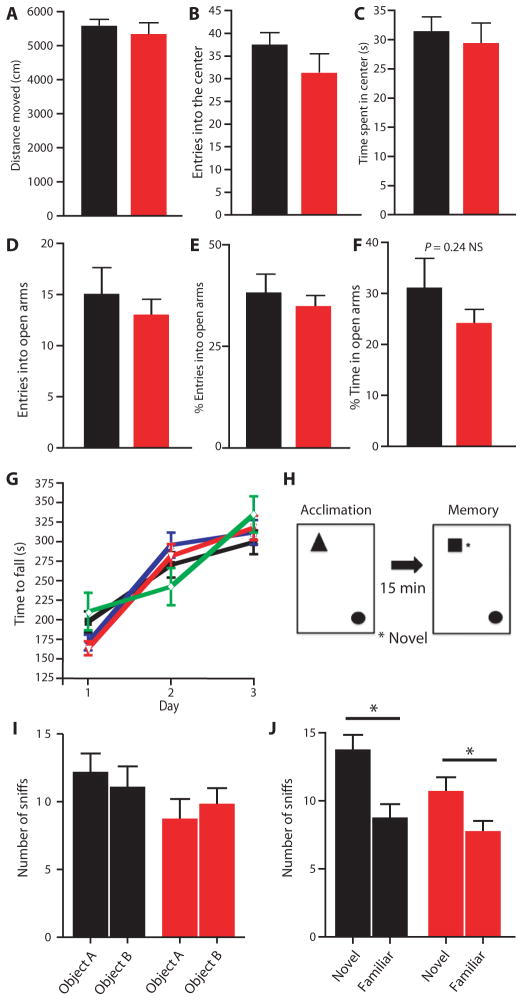
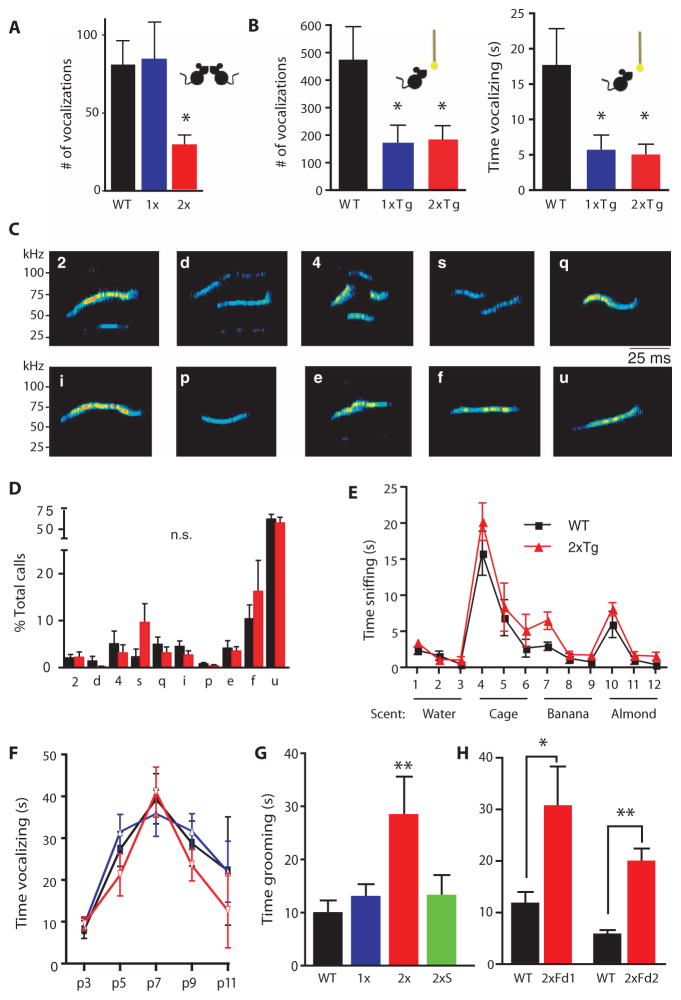
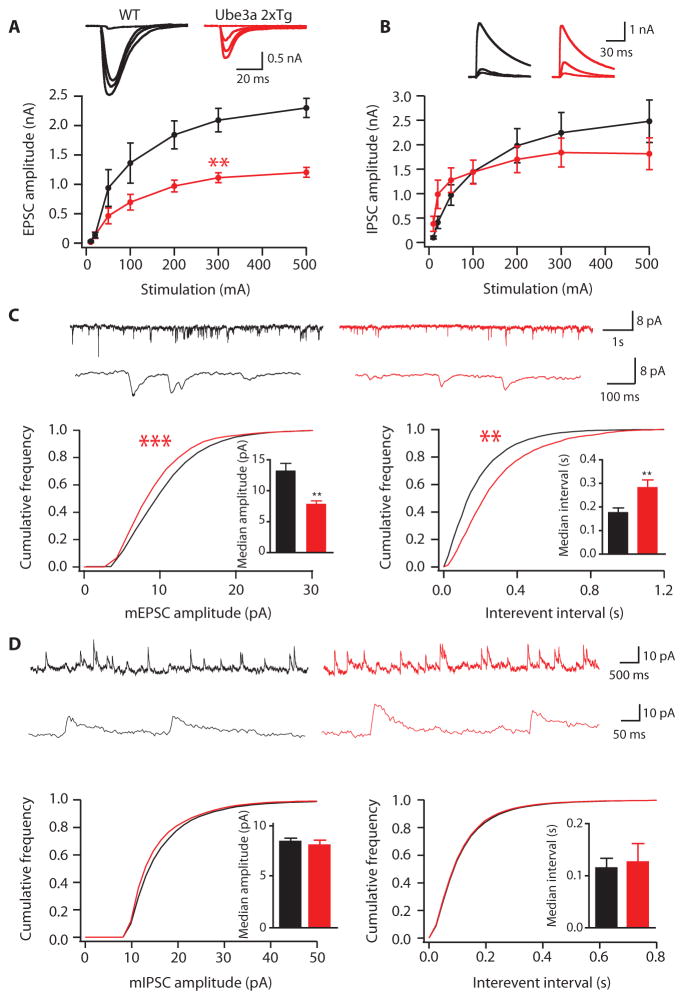
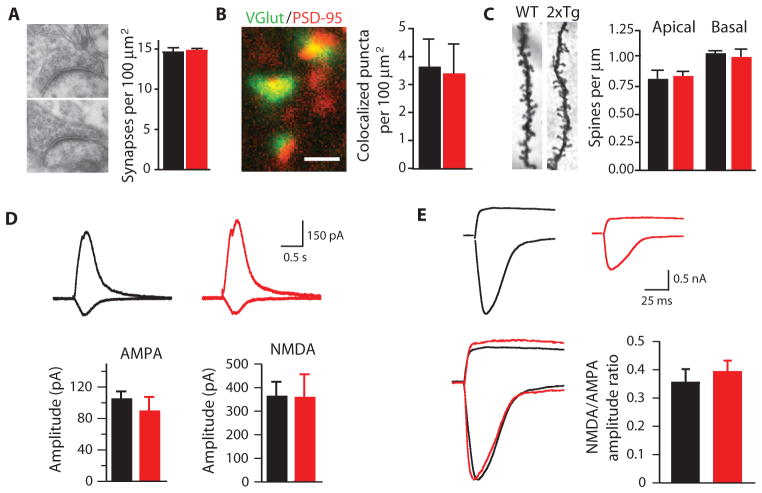
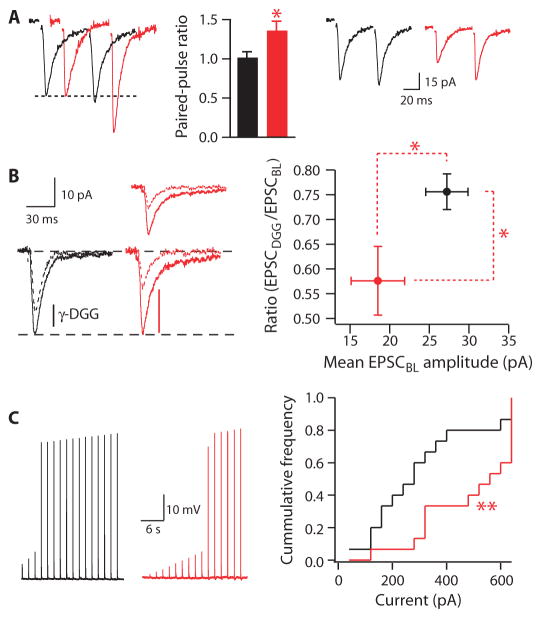
People with autism spectrum disorder are characterized by impaired social interaction, reduced communication, and increased repetitive behaviors. The disorder has a substantial genetic component, and recent studies have revealed frequent genome copy number variations (CNVs) in some individuals. A common CNV that occurs in 1 to 3% of those with autism--maternal 15q11-13 duplication (dup15) and triplication (isodicentric extranumerary chromosome, idic15)--affects several genes that have been suggested to underlie autism behavioral traits. To test this, we tripled the dosage of one of these genes, the ubiquitin protein ligase Ube3a, which is expressed solely from the maternal allele in mature neurons, and reconstituted the three core autism traits in mice: defective social interaction, impaired communication, and increased repetitive stereotypic behavior. The penetrance of these autism traits depended on Ube3a gene copy number. In animals with increased Ube3a gene dosage, glutamatergic, but not GABAergic, synaptic transmission was suppressed as a result of reduced presynaptic release probability, synaptic glutamate concentration, and postsynaptic action potential coupling. These results suggest that Ube3a gene dosage may contribute to the autism traits of individuals with maternal 15q11-13 duplication and support the idea that increased E3A ubiquitin ligase gene dosage results in reduced excitatory synaptic transmission.


Conflict of interest statement

Competing interests: The authors declare that they have no competing interests. A patent has been filed by Beth Israel Deaconess Medical Center on the animal model of autism reported in this paper with M.P.A. as inventor.

Figures

Fig. 1
Fig. 1
Expression of functional, full-length Ube3a gene BAC transgene Ube3a protein in the native expression pattern. (A) Schematic representation of the human genes located between breakpoint (BP) 1 and BP3 in the 15q11-13 region. Paternally expressed genes are blue, maternally expressed genes are red, and the location of the genomic DNA contained in the BAC is green. (B) Quantification of Ube3a protein in maternal Ube3a knockout (KO), wild-type (WT), 1×Tg, and 2×Tg Ube3a transgenic mice (total brain protein, Ube3a antibody) (ANOVA: F(3,24) = 26.95; *P < 0.05; **P < 0.001 by Dunnett’s post hoc, n = 4 to 11). (C) Western blot of Arc assessing degradation in vitro by transgenic Ube3a isoforms 2 and 3 (Ube3a-L) and isoform 1 (Ube3a-S). Ube3a was immunoprecipitated with FLAG antibody from total brain (ANOVA: F(2,6) = 9.93; *P < 0.05 by Dunnett’s post hoc, n = 3 independent in vitro assays). (D) Western blot of Arc in the barrel cortex in WT and 2×Tg mice. n = 10 to 12. *P = 0.03, two-tailed, unpaired t test. (E to G) Double immunofluorescence staining for total Ube3a (red) and Ube3a-FLAG transgene (green) (colocalization is shown in yellow) in (E) hippocampus and cortex, (F) superficial layers of the barrel cortex, and (G) CA3 of the hippocampus. Scale bars, 500 μm (E) and 100 μm [(F) and (G)].
Fig. 2
Fig. 2
Effects of increased Ube3a gene dosage on mouse social behavior. (A) Diagram of three-chamber social interaction test with acclimation to arena only and choice between a novel container containing a novel mouse and a novel empty container. (B) Time in social, middle, or opposite zone in juvenile WT, 1×Tg, and 2×Tg mice (*P = 0.0162 comparing within-genotype “Social” and “Opposite” by t test). (C) Time spent interacting with either the caged mouse (social) or the empty cage (opposite). (*P = 0.0157 and 0.0186, respectively, t test). n(WT, 1×, 2×) = 11, 15, and 12. (D) Diagram of a modified three-chambered social interaction test with acclimation to arena and cages (left) and a test session (right) in which the mouse chooses between exploring a familiar empty cage or a cage containing a novel mouse. (E) Time in social, middle, or opposite zone in adult WT, 1×Tg-L, 2×Tg-L, and 2×Tg-S mice. *P < 0.002, t test. (F) Time in area proximal to the enclosures (dark circles, “Close” zone). *P < 0.005, t test. n(WT, 1×, 2×) = 17, 10, and 15. (G) Time spent in proximity to a caged object after acclimation to chamber and cages, which tests for novel object exploration. *P < 0.03, t test, comparing within-genotype “Object” and “Opposite”; n = 11 to 13. (H) Time spent in social and opposite zone for independent Ube3a transgenic founder lines 1 (Fd1) and 2 (Fd2) (n = 10 and 5) and WT littermates (n = 7 and 4). **P < 0.01; ****P < 0.001, t test. Color code (used throughout): WT (black), single-transgenic long-form Ube3a (1×, blue), double-transgenic long-form Ube3a (2×, red), and double-transgenic short-form “inactive” Ube3a (2×S, green).
Fig. 3
Fig. 3
Effects of increased Ube3a gene dosage on anxiety-like and exploratory behavior, rotorod motor performance, or short-term object memory. (A to C) The open field tests exploratory behavior, comparing (A) distance traveled, (B) numbers of entries into the center, and (C) time spent in the center of an open field in double-transgenic long-form Ube3a (2×, red) and WT littermates. (D to F) The elevated plus maze tests anxiety-like behavior, assessing (D) number of entries into the open arms, (E) percentage of entries into the open arms, and (F) percent time spent in the open arms (NS, not significant). (G) The accelerating rotorod assesses motor performance in mice, comparing time to fall during three sequential days. (H to J) Short-term memory test in mice is diagrammed (H) and examines (I) number of object exploratory sniffs with first exposure to two novel objects during acclimation phase of memory test (left) and (J) number of object exploratory sniffs after one object is replaced by a new novel object (right), the memory phase of the test. (*P < 0.05, within genotype, t test). For complete statistics, see table S1.
Fig. 4
Fig. 4
Effect of increased Ube3a gene dosage on ultrasonic vocalizations and repetitive self-grooming. (A) Number of social ultrasonic vocalizations made by pairs of genotype-and sex-matched mice (Kruskal-Wallis test: H = 7.76, df = 2, P = 0.021, *P < 0.05 by Dunn’s multiple comparison post hoc, n = 8 to 14 pairs). (B) Ultrasonic vocalization responses of male mice to female urine as scored by number (ANOVA: F(2,22) = 4.52, P = 0.023, *P < 0.05 by Dunnett’s post hoc) and time spent vocalizing (ANOVA: F(2,22) = 5.31, P = 0.013, *P < 0.05 by Dunnett’s post hoc). n = 7 to 11. (C and D) Vocalization types, representative examples, and distribution in urine-exposed males, distinguished by shape and harmonics. n.s., not significant by ANOVA. (E) Time spent sniffing in the olfactory habituation/dishabituation test (genotype: two-way ANOVA: F(1,132) = 2.723, P = 0.12, n = 7). (F) Ultrasonic vocalizations of pups during acute maternal separation (ANOVA: F(2,262) = 0.87, P = 0.42, n = 10 to 14). (G) Repetitive self-grooming (ANOVA: F(2,34) = 5.41, P = 0.0095, **P < 0.01 by Dunnett’s post hoc, n = 11 to 12). (H) Repetitive self-grooming in independent Ube3a transgenic founder lines Fd1 (nWT, 2× = 10 and 14) and Fd2 (nWT, 2× = 3,5). *P = 0.01; **P = 0.004, t test.
Fig. 5
Fig. 5
Effect of increased (2×Tg) Ube3a gene dosage on excitatory and inhibitory synaptic transmission in slices from somatosensory whisker barrel cortex layer 2/3 pyramidal neurons. Black, WT; red, Ube3a 2×Tg. (A) Evoked EPSC traces and graph (ANOVA: F(1,97) = 41.45, **P < 0.001, n = 6 to 8). (B) Evoked IPSC traces and graph (ANOVA: F(1,83) = 0.03, P = 0.8551, n = 6). (C) mEPSC traces (top) and cumulative frequency plots of amplitude (bottom, left) and interevent interval (bottom, right) (Kolmogorov-Smirnov test: **P < 0.01, ***P < 0.001; n = 9 to 11). (Insets) Median mEPSC amplitude (left; P < 0.01, t test) and frequency (right; P < 0.01, t test; n = 9 to 11). (D) mIPSC traces and cumulative amplitude (left) and frequency (right) plots (P > 0.05, Kolmogorov-Smirnov test; n = 9 to 11). (Insets) Median mIPSC amplitude (left) and frequency (right) compared across genotypes (P > 0.05, t test).
Fig. 6
Fig. 6
Effect of increased (2×Tg) Ube3a gene dosage on glutamate synapse number and postsynaptic glutamate receptor currents. Black, WT; red, Ube3a 2×Tg. (A) Synapse number, as measured by electron microscopy (P = 0.67, t test; n = 3 animals per group; 28 to 32 micrographs per animal). (B) Colocalized immunostaining of presynaptic (VGlut1) and postsynaptic (PSD-95) synaptic markers (scale bar, 1 μm; P = 0.8706, t test; n = 4 animals per group; eight or more micrographs per animal). (C) Spine number per dendrite length, as shown by Golgi staining (apical: P = 0.64; basal: P = 0.77, t test; n = 4 animals per group; ≥10 dendrites per animal). (D) Glutamate ionophoresis–induced AMPA and NMDA currents (AMPA: P = 0.46, t test; n = 5 to 6; NMDA: P = 0.97, t test; n = 3 to 6). (E) Fiber stimulation–evoked AMPA/NMDA traces (above, unscaled; below, scaled to WT) and ratio (P = 0.54, t test; n = 6 to 8).
Fig. 7
Fig. 7
Effect of increased (2×Tg) Ube3a gene dosage on glutamate synapse release probability, synaptic glutamate concentration, and ES coupling. Black, WT; red, Ube3a 2×Tg. (A) Representative unscaled paired-pulse traces (right), traces scaled to match first pulse to WT (left), and bar graph (P = 0.028, t test; n = 7 to 10). (B) Representative traces of unscaled (above) and scaled-to-WT (below) evoked EPSCs with (dotted lines) or without (solid lines) γ-DGG and graph (right) (*P = 0.0127, t test; n = 7 to 8). (C) Representative voltage tracings (left) and graph (right) assessing action potential firing to a 5-ms EPSC-like somatic current (0 to 640 pA, 40-pA steps). **P = 0.003, χ2 test (n = 14 to 17).

References

    1. Levy SE, Mandell DS, Schultz RT. Autism. Lancet. 2009;374:1627–1638. - PMC - PubMed
    1. Abrahams BS, Geschwind DH. Advances in autism genetics: On the threshold of a new neurobiology. Nat Rev Genet. 2008;9:341–355. - PMC - PubMed
    1. Glessner JT, Wang K, Cai G, Korvatska O, Kim CE, Wood S, Zhang H, Estes A, Brune CW, Bradfield JP, Imielinski M, Frackelton EC, Reichert J, Crawford EL, Munson J, Sleiman PM, Chiavacci R, Annaiah K, Thomas K, Hou C, Glaberson W, Flory J, Otieno F, Garris M, Soorya L, Klei L, Piven J, Meyer KJ, Anagnostou E, Sakurai T, Game RM, Rudd DS, Zurawiecki D, McDougle CJ, Davis LK, Miller J, Posey DJ, Michaels S, Kolevzon A, Silverman JM, Bernier R, Levy SE, Schultz RT, Dawson G, Owley T, McMahon WM, Wassink TH, Sweeney JA, Nurnberger JI, Coon H, Sutcliffe JS, Minshew NJ, Grant SF, Bucan M, Cook EH, Buxbaum JD, Devlin B, Schellenberg GD, Hakonarson H. Autism genome-wide copy number variation reveals ubiquitin and neuronal genes. Nature. 2009;459:569–573. - PMC - PubMed
    1. Morrow EM, Yoo SY, Flavell SW, Kim TK, Lin Y, Hill RS, Mukaddes NM, Balkhy S, Gascon G, Hashmi A, Al-Saad S, Ware J, Joseph RM, Greenblatt R, Gleason D, Ertelt JA, Apse KA, Bodell A, Partlow JN, Barry B, Yao H, Markianos K, Ferland RJ, Greenberg ME, Walsh CA. Identifying autism loci and genes by tracing recent shared ancestry. Science. 2008;321:218–223. - PMC - PubMed
    1. Pinto D, Pagnamenta AT, Klei L, Anney R, Merico D, Regan R, Conroy J, Magalhaes TR, Correia C, Abrahams BS, Almeida J, Bacchelli E, Bader GD, Bailey AJ, Baird G, Battaglia A, Berney T, Bolshakova N, Bölte S, Bolton PF, Bourgeron T, Brennan S, Brian J, Bryson SE, Carson AR, Casallo G, Casey J, Chung BH, Cochrane L, Corsello C, Crawford EL, Crossett A, Cytrynbaum C, Dawson G, de Jonge M, Delorme R, Drmic I, Duketis E, Duque F, Estes A, Farrar P, Fernandez BA, Folstein SE, Fombonne E, Freitag CM, Gilbert J, Gillberg C, Glessner JT, Goldberg J, Green A, Green J, Guter SJ, Hakonarson H, Heron EA, Hill M, Holt R, Howe JL, Hughes G, Hus V, Igliozzi R, Kim C, Klauck SM, Kolevzon A, Korvatska O, Kustanovich V, Lajonchere CM, Lamb JA, Laskawiec M, Leboyer M, Le Couteur A, Leventhal BL, Lionel AC, Liu XQ, Lord C, Lotspeich L, Lund SC, Maestrini E, Mahoney W, Mantoulan C, Marshall CR, McConachie H, McDougle CJ, McGrath J, McMahon WM, Merikangas A, Migita O, Minshew NJ, Mirza GK, Munson J, Nelson SF, Noakes C, Noor A, Nygren G, Oliveira G, Papanikolaou K, Parr JR, Parrini B, Paton T, Pickles A, Pilorge M, Piven J, Ponting CP, Posey DJ, Poustka A, Poustka F, Prasad A, Ragoussis J, Renshaw K, Rickaby J, Roberts W, Roeder K, Roge B, Rutter ML, Bierut LJ, Rice JP, Salt J, Sansom K, Sato D, Segurado R, Sequeira AF, Senman L, Shah N, Sheffield VC, Soorya L, Sousa I, Stein O, Sykes N, Stoppioni V, Strawbridge C, Tancredi R, Tansey K, Thiruvahindrapduram B, Thompson AP, Thomson S, Tryfon A, Tsiantis J, Van Engeland H, Vincent JB, Volkmar F, Wallace S, Wang K, Wang Z, Wassink TH, Webber C, Weksberg R, Wing K, Wittemeyer K, Wood S, Wu J, Yaspan BL, Zurawiecki D, Zwaigenbaum L, Buxbaum JD, Cantor RM, Cook EH, Coon H, Cuccaro ML, Devlin B, Ennis S, Gallagher L, Geschwind DH, Gill M, Haines JL, Hallmayer J, Miller J, Monaco AP, Nurnberger JI, Jr, Paterson AD, Pericak-Vance MA, Schellenberg GD, Szatmari P, Vicente AM, Vieland VJ, Wijsman EM, Scherer SW, Sutcliffe JS, Betancur C. Functional impact of global rare copy number variation in autism spectrum disorders. Nature. 2010;466:368–372. - PMC - PubMed

Publication types

LinkOut - more resources