. 2011 Dec;41(12):1142-55.
doi: 10.1016/j.compbiomed.2011.09.004. Epub 2011 Oct 4.

Vector autoregression, structural equation modeling, and their synthesis in neuroimaging data analysis

Affiliations

Vector autoregression, structural equation modeling, and their synthesis in neuroimaging data analysis

Gang Chen et al. Comput Biol Med. 2011 Dec.

Abstract

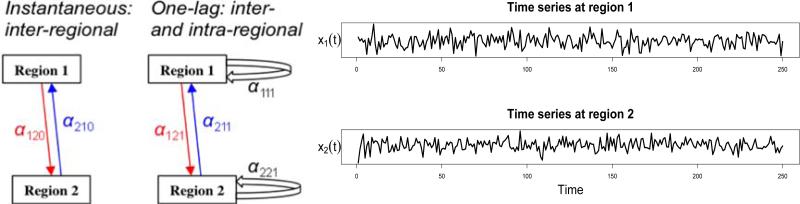
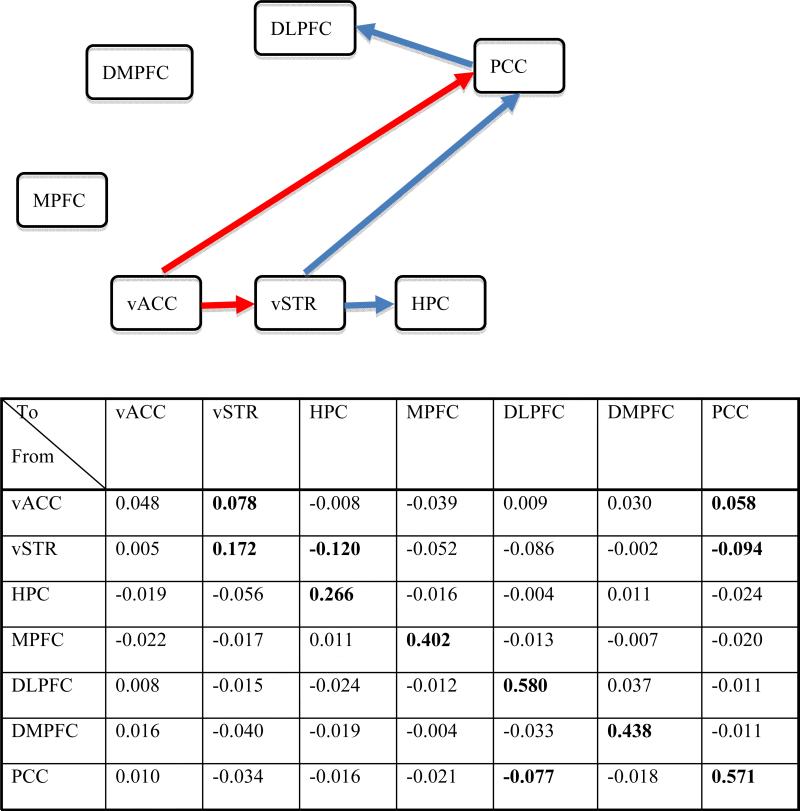
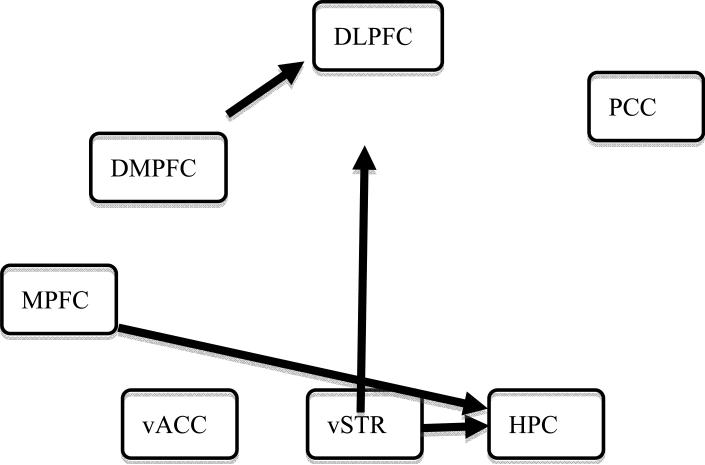
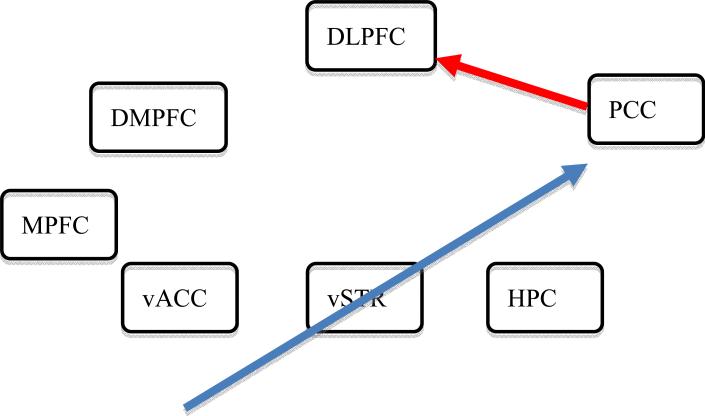
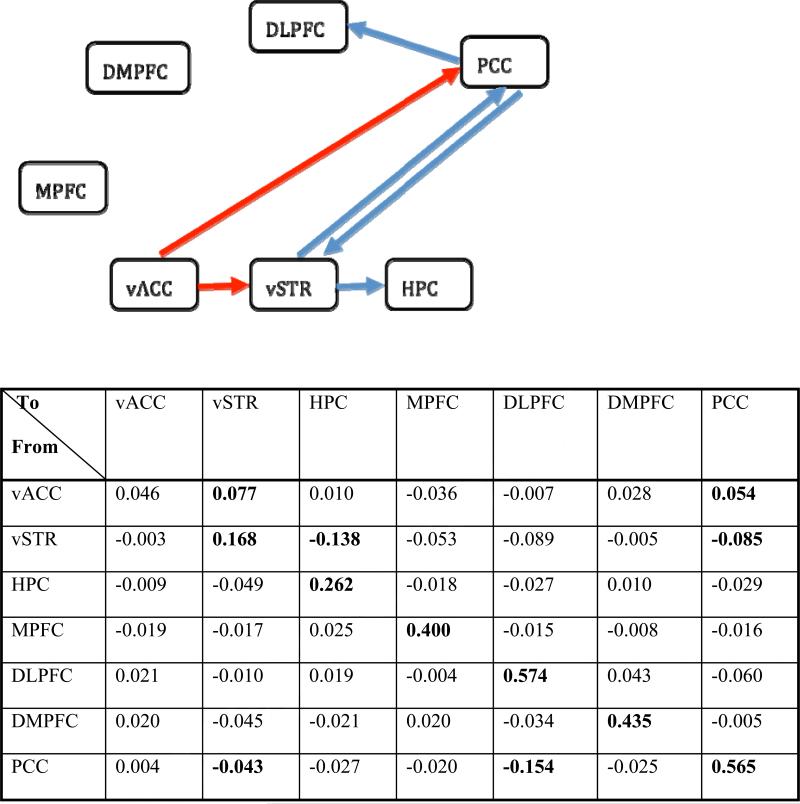
Vector autoregression (VAR) and structural equation modeling (SEM) are two popular brain-network modeling tools. VAR, which is a data-driven approach, assumes that connected regions exert time-lagged influences on one another. In contrast, the hypothesis-driven SEM is used to validate an existing connectivity model where connected regions have contemporaneous interactions among them. We present the two models in detail and discuss their applicability to FMRI data, and their interpretational limits. We also propose a unified approach that models both lagged and contemporaneous effects. The unifying model, structural vector autoregression (SVAR), may improve statistical and explanatory power, and avoid some prevalent pitfalls that can occur when VAR and SEM are utilized separately.


Figures

Figure 1
Figure 1
(Left) A hypothesized network of two regions, 1 and 2, with excitatory (red) instantaneous and one-lag effect of region 1 on region 2, and inhibitory (blue) instantaneous and one-lag effect of region 2 on region 1. (Right) Based on two time series of 250 data points with a sampling interval of 1.2 seconds acquired from both regions under resting state, can we derive the interregional relations?
Fig. 2
Fig. 2
Validation of the optimization scheme in 1dSEM with data and a theoretical model from [22] with five regions: supplementary motor area (SMA), inferior frontal gyrus (IFG), inferior parietal lobule (IPL), ventral extrastriate cortex (VEC), and prefrontal cortex (PFC). The estimated path coefficients are equivalent to the published results within an accuracy of 10-3. Runtime was about 1 s on a Mac OS X with a 2 × 2.66 GHz dual-core Intel Xeon processor. χ2(9) = 12.4, p = 0.183, AIC index = 24.57, Bollen's parsimonious fit index = 0.71.
Fig. 3
Fig. 3
(Left) An optimal model of 6 paths found through automated tree growth search in LISREL by [22]. χ2(9) = 11.19 (p = 0.26), AIC index = 23.19, Bollen's parsimonious fit index = 0.75. The same path coefficients, statistics and fit indices were verified for this specific model with 1dSEM and 1dSEMr. (Middle) An optimal network of six paths identified based on “tree growth” with 1dSEM. Runtime = 4 s on a Mac OS X with a 2 × 2.66 GHz dual-core Intel Xeon processor. χ2(9) = 6.55 (p = 0.69), AIC = 18.55, Bollen's parsimonious fit index = 0.85. (Right) An optimal model of six paths found through automated “forest growth” in 1dSEM. Runtime = 42.5 s on the same Mac. χ2(9) = 5.34 (p = 0.88), AIC = 17.36, Bollen's parsimonious fit index = 0.93. Notice the χ2 value (or discrepancy) and AIC index of both the “tree growth” and “forest growth” networks are lower than the optimal model in [22] while the parsimonious fit index is higher, indicating our optimization algorithm is more robust than the LISREL setup adopted in [22].
Fig. 4
Fig. 4
Six regions showing between-groups differences in leading and lagging temporal association with vACC. The individual subject analyses were performed with a first-order bivariate autoregression in 3dGC. Among the six regions, three are one-lag effects from seed (vACC) to the rest of the brain (upper panel), while the other three are from the rest of the brain (lower panel) to the seed identified. Bold numbers in the tables indicate a significance level of p < 0.05, FWE corrected. The color, red, in the brain images means the path strength contrast is positive between the MDD and control (CTL) groups, and vice versa for the blue color.
Fig. 5
Fig. 5
The table shows the group-level one-lag path coefficients estimated with 1dGC for the control subjects. Each number along the diagonal shows the within-region effect while each off-diagonal value indicates the path strength from the region in the row to the region in the column. The numbers in bold indicate a significance level of two-tailed p < 0.05, uncorrected. All regions except vACC have significant serial correlation, while the VAR(1) model indicates five significant directional paths: vACC → vSTR, vACC → PCC, vSTR → HPC, vSTR → PCC, and PCC → DLPFC. The network is shown with only interregional paths because serial correlation within a region is general not of interest: red, excitatory effect; blue, inhibitory effect. In control subjects, MPFC and DMPFC are not identified to be involved in the network.
Fig. 6
Fig. 6
Path diagram identified with a one-sample t-test on the logarithm of the F-statistics from 14 control subjects, as typically done for group analysis (e.g., [10]). The network revealed is very different from the one (Fig. 5) identified with 1dGC, and the path strength at the group level cannot be identified since such information is not considered as input for group analysis with this approach. Information about the sign of the paths is also lost.
Fig. 7
Fig. 7
Group-level instantaneous effects identified in 1dSVAR for control subjects with a model incorporating the lagged effects revealed through VAR(1) in 1dGC are: vACC → vSTR, 0.047; vSTR → HPC, 0.055; PCC → DLPFC: 0.064; vACC → PCC: -0.060; vSTR → PCC: -0.058. Each value indicates the path strength from the row region to the column one. Two paths (shown in the network), vACC → PCC and PCC → DLPFC, were identified at a significance level of p < 0.05 (two-tailed), uncorrected; excitatory effects are shown in red and inhibitory effects in blue.
Fig. 8
Fig. 8
The table shows the one-lag path coefficients for the control group estimated with 1dSVAR. Each diagonal number shows a within-region effect while each off-diagonal value indicates a cross-region strength from the row region to the column region. The numbers in bold indicate a significance level of two-tailed p < 0.05, uncorrected. All regions except vACC have significant intraregional serial correlation, while the SVAR(1) model indicates five significant directional paths: vACC → vSTR, vACC → PCC, vSTR → HPC, vSTR → PCC, and PCC → DLPFC. The network is shown with only interregional paths: red, excitatory effect; blue, inhibitory effect. MPFC and DMPFC are not identified to be involved in the network among control subjects. The path strengths and network are similar to the ones identified with 1dGC (Fig. 5) except for the one-lag path PCC → vSTR identified with 1dSVAR (p = 0.023), but not with 1dGC (p = 0.073).
Fig. 9
Fig. 9
Suppose that a network with three regions has a true causal relationship of A → B → C (middle), and that data collected with appropriate temporal resolution (left) reveal the real network of delayed effects with a lag of one time unit. However, if region B is not included in a VAR or SVAR model, we would identify only the path A → C (right) in the network of delayed effects with a lag of two time units, leading to a spurious finding (red arrow in the right map).
Fig. 10
Fig. 10
Suppose that a network with three regions has a true causal relationship of A → B → C (middle), and that data with adequate temporal resolution (left) reveal the real network with a VAR or SVAR model incorporating a lag of one time unit. However, if the middle time point is not available, we would identify the path A → C (right) with a lag of two time units, leading to a spurious finding (red arrow in the right map).

References

    1. Gitelman DR, Penny WD, Ashburner J, Friston KJ. Modeling regional and psychophysiologic interactions in fMRI: the importance of hemodynamic deconvolution. NeuroImage. 2003;19:200–207. - PubMed
    1. Roebroeck A, Formisano E, Goebel R. Mapping directed influence over the brain using granger causality mapping. NeuroImage. 2005;25:230–242. - PubMed
    1. McIntosh AR, Gonzalez-Lima F. Structural equation modeling and its application to network analysis in functional brain imaging. Hum. Brain Mapp. 1994;2:2–22.
    1. Friston KJ, Harrison L, Penny W. Dynamic causal modeling. Neuroimage. 2003;19:1273–1302. - PubMed
    1. Friston KJ. Functional integration. In: Frackowiak RSJ, Friston KJ, Frith C, Dolan R, Friston KJ, Price CJ, Zeki S, Ashburner J, Penny WD, editors. Human Brain Function. 2nd ed. Academic Press; 2003.

Publication types