. 2012 Jan;107(1):178-95.
doi: 10.1152/jn.00961.2010. Epub 2011 Oct 5.

Hierarchical control of motor units in voluntary contractions

Affiliations

Hierarchical control of motor units in voluntary contractions

Carlo J De Luca et al. J Neurophysiol. 2012 Jan.

Abstract

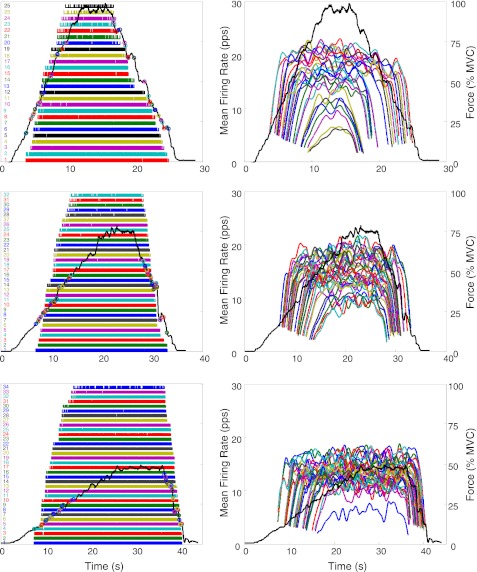
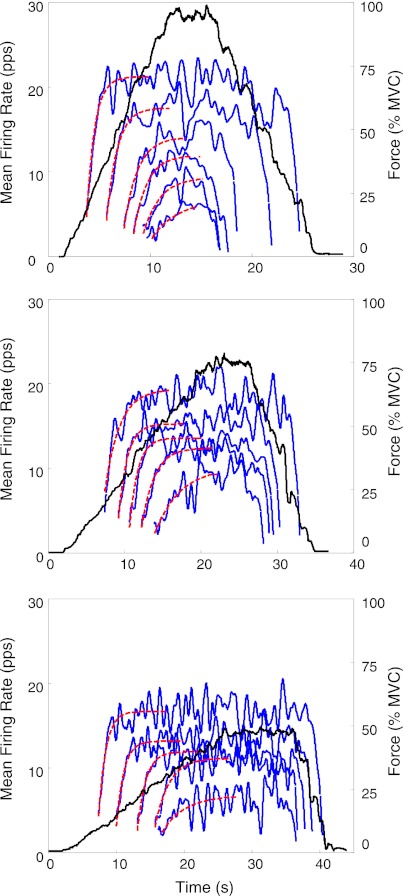
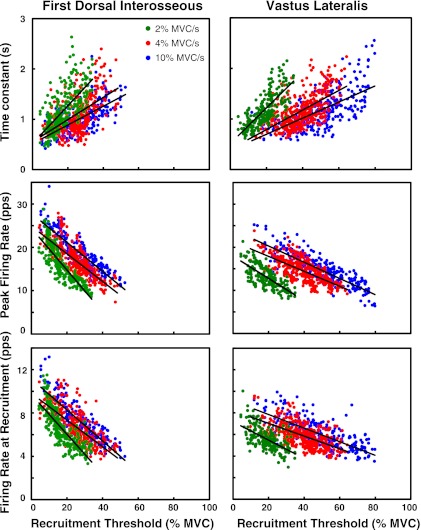
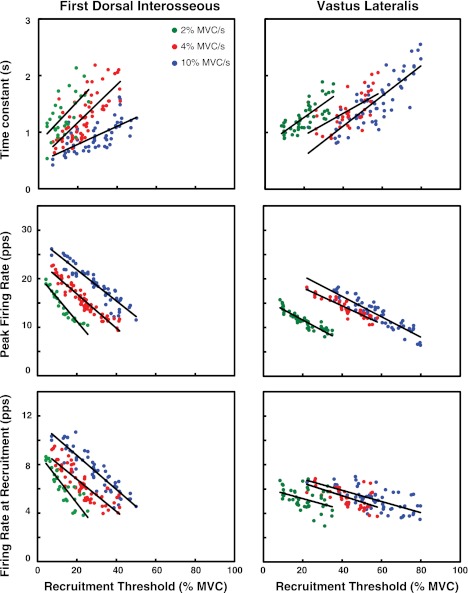
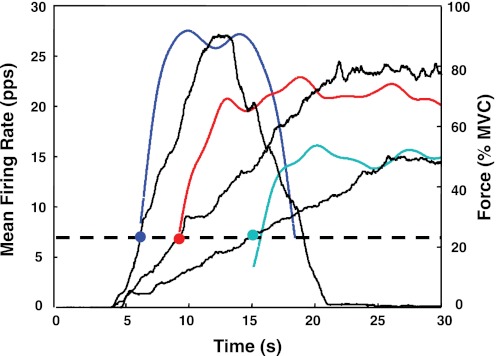
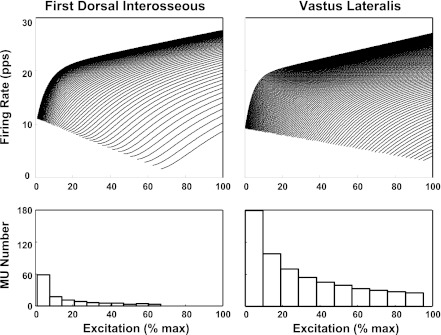
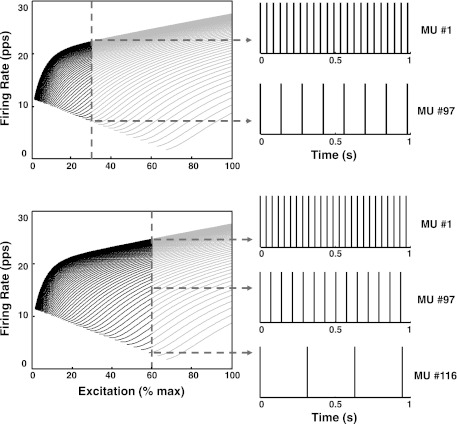
For the past five decades there has been wide acceptance of a relationship between the firing rate of motor units and the afterhyperpolarization of motoneurons. It has been promulgated that the higher-threshold, larger-soma, motoneurons fire faster than the lower-threshold, smaller-soma, motor units. This relationship was based on studies on anesthetized cats with electrically stimulated motoneurons. We questioned its applicability to motor unit control during voluntary contractions in humans. We found that during linearly force-increasing contractions, firing rates increased as exponential functions. At any time and force level, including at recruitment, the firing rate values were inversely related to the recruitment threshold of the motor unit. The time constants of the exponential functions were directly related to the recruitment threshold. From the Henneman size principle it follows that the characteristics of the firing rates are also related to the size of the soma. The "firing rate spectrum" presents a beautifully simple control scheme in which, at any given time or force, the firing rate value of earlier-recruited motor units is greater than that of later-recruited motor units. This hierarchical control scheme describes a mechanism that provides an effective economy of force generation for the earlier-recruited lower force-twitch motor units, and reduces the fatigue of later-recruited higher force-twitch motor units-both characteristics being well suited for generating and sustaining force during the fight-or-flight response.


Figures

Fig. 1.
Fig. 1.
An example of the results of the decomposition of surface EMG (sEMG) signals detected during 3 isometric constant-force contractions of the vastus lateralis (VL) muscle: up to 100% maximum voluntary contraction (MVC) at 10% MVC/s (top), up to 80% MVC at 4% MVC/s (middle), and up to 50% MVC at 2% MVC/s (bottom). The dark solid line represents the force output scaled in % of MVC. Left: firing instances of the decomposed motor units are represented with vertical bars. Circles represent the location of the motor unit recruitment and derecruitment. Right: time-varying mean firing rates. Firing rates were filtered with a unit-area Hanning window of 2 s. pps, Pulses per second.
Fig. 2.
Fig. 2.
Examples of the fit of an exponential function to the mean firing rates in 3 contractions performed with the VL muscle at different rates: 10% MVC/s up to 100% MVC (top), 4% MVC/s up to 80% MVC (middle), and 2% MVC/s up to 50% MVC (bottom). Blue lines represent the mean firing rates of the motor units, which were low-pass filtered with a 1-s unit-area Hanning window. Red dashed lines represent the exponential functions obtained from fitting Eq. 1 by optimizing the firing rate at recruitment, the maximal firing rate, and the time constant of the exponential increase. Note that firing rates of motor units recruited at progressively higher thresholds have a progressively more sluggish rise time, which suggests greater time constants.
Fig. 3.
Fig. 3.
Grouped values from all 8 subjects for the firing rates at recruitment (λr), the peak firing rates (λp), and the time constant (θ) vs. the recruitment threshold (τ) for the first dorsal interosseus (FDI) and VL muscles. Results from the contractions performed at 10%, 4%, and 2% MVC/s up to 100%, 80%, and 50% MVC are presented in blue, red, and green, respectively.
Fig. 4.
Fig. 4.
Values for the firing rates at recruitment (λr), the peak firing rates (λp), and the time constant (θ) of the firing rate vs. the recruitment threshold (τ) for the FDI and VL muscles of 1 individual subject. Results from the contractions performed at 10%, 4%, and 2% MVC/s up to 100%, 80%, and 50% MVC are presented in blue, red, and green, respectively.
Fig. 5.
Fig. 5.
The mean firing rate behavior of 3 different motor units recruited at approximately the same force level is shown as the force of the contraction increases at different rates (10%, 4%, and 2% MVC/s). Note how the rate of rise of the mean firing rate trajectories is similar regardless of the different rate of rise of the force.
Fig. 6.
Fig. 6.
Top: the firing rate spectrum calculated from Eq. 10A for the FDI and Eq. 10B for the VL for some selected motoneurons in the pool of the respective muscles. Note that the firing rate at recruitment is inversely proportional to the recruitment threshold for both muscles and the pattern of the spectra are largely similar, with mild difference between the 2 muscles. For purpose of clarity 1 of every 2 motor units and 1 of every 6 motor units are shown for the FDI and VL muscles, respectively. Bottom: the distribution of recruitment thresholds as a function of excitation for the FDI and VL muscles. The distribution for the FDI is obtained from Eq. 11 (Fuglevand et al. 1993); the similar but less skewed distribution for the VL muscle is obtained from a slightly different equation (Eq. 12) (see text for details). Note that the FDI muscle has a lower number of motor units whose recruitment threshold distribution is skewed to the lower end of the firing rate spectrum compared with that of the VL muscle. Also, the maximal recruitment threshold is greater for the VL than for the FDI muscle.
Fig. 7.
Fig. 7.
A schematic displaying the interpretation of the firing rate spectrum described in Fig. 6. Top: the vertical line indicates the excitation required to produce a constant-force isometric contraction at 30% MVC. This is the common drive to the motoneuron pool. The motoneurons to the left of the excitation line respond to the excitation. The intersection of the vertical line with each of the firing rates corresponds to the value of the firing rate of each motoneuron at the 30% excitation level. Note that earlier-recruited motoneurons have progressively greater firing rates. This is made clear on the right of the panel, which presents the firing impulses of the first recruited motoneuron (1) and the last recruited motoneuron (97) in the distribution. Bottom: the excitation is moved to 60% MVC. Additional motoneurons are recruited, and the excitation line now intersects the firing rates at greater values. This behavior is shown on the firing trains on right of the spectra: the shorter firing intervals indicate that the firing rates of all the motoneurons increase, and the additional train at bottom indicates that new motoneurons (up to 116) have been recruited.
Fig. 8.
Fig. 8.
Diagram of the procedure for measuring the accuracy of the algorithm and for testing the algorithm for the absence of a biased structured result. The test for accuracy involves steps A and B (top). The test for bias involves steps A, C, and D (bottom). Accuracy test: a real sEMG signal is decomposed to obtain all the firing instances and the action potential shapes of all the identifiable motor unit action potential trains (MUAPTs) in the signal [original decomposed MUAPTs (dMUAPTs) in A]. The firing instances and the action potential shapes are used to construct a synthesized signal of MUAPTs to which Gaussian noise is added. The synthesized signal of MUAPTs is then decomposed, and the results of the decomposition (dMUAPTs in B) are compared with the decomposition of the real sEMG signal (original dMUAPTs in A). Test for bias: the test for bias is similar to the test for accuracy with the only addition of a randomization process (C). The identified firing times of each motor unit obtained from the decomposition of a real sEMG signal undergo a stochastic process whereby firings are either randomly inserted or deleted until all motor unit trains have approximately the same number of firings (randomized MUAPTs in C). The randomized trains and action potential shapes are then used to construct a synthesized signal, which is comprised of randomized MUAPTs that do not present structured behavior. The synthesized signal of randomized MUAPTs is decomposed, and the output of the decomposition algorithm (randomized dMUAPTs in D) is compared with the input to the decomposition algorithm (randomized MUAPTs in C).
Fig. 9.
Fig. 9.
Test for measuring the accuracy of the decomposition algorithm and for proving that the algorithm does not bias the behavior of the firing rates of the dMUAPTs. Left: A: firing instances of a set of 46 MUAPTs that were decomposed from a real sEMG signal obtained from a 35% MVC contraction from the VL muscle. The dark line represents the force output of the muscle. B: firing instances of each of the original MUAPTs (in A) that were randomized according to the description in the text. C: firing instances of the MUAPTs that were obtained by decomposing the synthesized signal of the randomized MUAPTs in B. Note that the MUAPTs identified by the decomposition were the same as the 46 that were used to construct the synthesized signal of randomized MUAPTs, as evidenced by the shapes of the action potentials presented in Fig. 10. The expansions on right show 1-s epoch of 9 selected MUAPTs in all 3 segments (A, B, and C). The MUAPTs are presented in groups of 3. The top one (a) contains those from the original dMUAPTs in the top section (A). The middle one (b) contains those with the randomized firing instances in the middle section (B). The bottom one (c) contains those from the decomposed signal constructed from the randomized MUAPTs in the bottom section (C). Note that the randomization effect is noticeable when comparing the middle train to the top train. The accuracy of the decomposition algorithm is noticeable when comparing the bottom train to the middle train. These latter 2 are nearly similar, as would be expected from the measured high (95.4 ± 1.2%) accuracy value of the decomposition of the synthesized signal of randomized MUAPTs. Note that this accuracy value is similar to that obtained by the decomposition of the synthesized, but not randomized, signal of MUAPTs (95.6 ± 0.8%). For details of the method used to calculate the accuracy, refer to appendix 1. Right: mean firing rates computed by low-pass filtering the 46 MUAPTs in the 3 segments shown on left with a Hanning window of 1-s duration. On right the mean firing rates of motor units 1 and 45 are provided for clarity. Note that the mean firing rates computed from the original dMUAPTs (top section) present a hierarchical sequence. The range of firing rates between the first and the last recruited motor unit is ∼18 pps, whereas the mean firing rates computed from the randomized MUAPTs (middle section) as well as those computed from the randomized dMUAPTs (bottom section) all present firing rates with similar values (∼20 pps). This is a proof that the algorithm does not bias the data to artificially introduce the structured behavior clearly observable in the real sEMG signal of the top section.
Fig. 10.
Fig. 10.
Here we show the action potentials of the 46 MUAPTs presented in Fig. 9 and a detailed comparison of the firing instances. Top: the blue action potential shapes belong to the MUAPTs that were identified in the decomposition of the real sEMG signal (top segment in Fig. 9) and were used to construct the signal with randomized firing instances. The red action potentials were obtained by the decomposition of the randomized signal constructed with the blue action potentials and with randomized firing instances. Note the similarity. Bottom: a short epoch of the firings of the first and last 10 MUAPTs. Bars and quiescent periods between bars represent the firing instances of the randomized MUAPTs in Fig. 9B [true positive (TP) and true negative (TN)]; Xs indicate those from the MUAPTs obtained from the decomposition of the synthesized signal in Fig. 9C constructed from the randomized MUAPTs. A red circle represents a missing firing [false negative (FN)] that is not recognized in the MUAPT from the decomposition of the synthesized signal. A red cross indicates an additional firing [false positive (FP)] in the MUAPT from the decomposition of the synthesized signal that is not present in the randomized MUAPT. The accuracy of the decomposition and the number of errors per second are listed at bottom left. In the presented MUAPTs the accuracy ranges from 95.1% to 100%. The average accuracy over all 46 MUAPTs is 95.4 ± 1.2%.
Fig. 11.
Fig. 11.
Influence of the filtering window on the estimate of the time constant of the firing rates. Top: instantaneous firing rates of some selected motor units and the superimposed mean firing rates, computed by filtering the motor unit impulse trains with a Hanning window of 1-s duration, are presented for 2 different contractions. A slow (2% MVC/s) contraction from the FDI muscle is shown on left, and a fast (10% MVC/s) contraction from the VL muscle is shown on right. For clarity, only 3 motor units (2, 22, 35) are shown for the FDI muscle and 2 motor units (2, 14) for the VL muscle. Note that the instantaneous firing rates are presented up to 60 pps. Middle: mean firing rates computed by filtering the motor unit trains with a 1-s Hanning window are presented for all motor units identified in the 2 contractions (35 motor units and 15 motor units in the FDI and VL muscle, respectively). Bottom: relation between the recruitment threshold and the time constant of the firing rate estimated by fitting the mean firing rate trajectories with Eq. 1 (see text). The individual regression lines are obtained as the firing rate trajectories are computed with length of the Hanning window ranging from 1 to 4 s.

References

    1. Adam A, De Luca CJ, Erim Z. Hand dominance and motor unit firing behavior. J Neurophysiol 80: 1373–1382, 1998 - PubMed
    1. Adrian ED, Bronk DW. The discharge of impulses in motor nerve fibres. II. The frequency of discharge in reflex and voluntary contractions. J Physiol 67: i3–i51, 1929 - PMC - PubMed
    1. Barry BK, Pascoe MA, Jesunathadas M, Enoka RM. Rate coding is compressed but variability is unaltered for motor units in a hand muscle of old adults. J Neurophysiol 97: 3206–3218, 2007 - PubMed
    1. Bracchi F, Decandia M, Gualtierotti T. Frequency stabilization in the motor centers of spinal cord and caudal brain stem. Am J Physiol 210: 1170–1177, 1966 - PubMed
    1. Christensen E. Topography of terminal motor innervation in striated muscles from stillborn infants. Am J Phys Med 38: 65–78, 1959 - PubMed

Publication types

LinkOut - more resources