

An algorithm for 353 odor detection thresholds in humans
- PMID: 21976369
- PMCID: PMC3278675
- DOI: 10.1093/chemse/bjr094
An algorithm for 353 odor detection thresholds in humans
Abstract
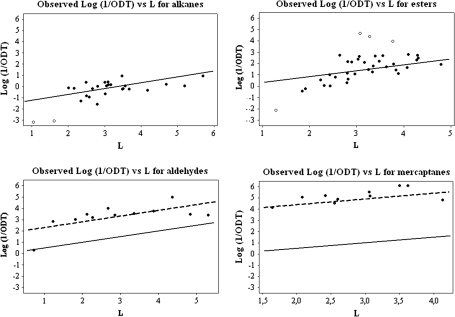
One hundred and ninety three odor detection thresholds, ODTs, obtained by Nagata using the Japanese triangular bag method can be correlated as log (1/ODT) by a linear equation with R(2) = 0.748 and a standard deviation, SD, of 0.830 log units; the latter may be compared with our estimate of 0.66 log units for the self-consistency of Nagata's data. Aldehydes, acids, unsaturated esters, and mercaptans were included in the equation through indicator variables that took into account the higher potency of these compounds. The ODTs obtained by Cometto-Muñiz and Cain, by Cometto-Muñiz and Abraham, and by Hellman and Small could be put on the same scale as those of Nagata to yield a linear equation for 353 ODTs with R(2) = 0.759 and SD = 0.819 log units. The compound descriptors are available for several thousand compounds, and can be calculated from structure, so that further ODT values on the Nagata scale can be predicted for a host of volatile or semivolatile compounds.
Figures

Similar articles
-
An algorithm for nasal pungency thresholds in man.Arch Toxicol. 1998 Mar;72(4):227-32. doi: 10.1007/s002040050493. Arch Toxicol. 1998. PMID: 9587018
-
The biological and toxicological activity of gases and vapors.Toxicol In Vitro. 2010 Mar;24(2):357-62. doi: 10.1016/j.tiv.2009.11.009. Epub 2009 Nov 12. Toxicol In Vitro. 2010. PMID: 19913608 Free PMC article.
-
A quantitative structure activity analysis on the relative sensitivity of the olfactory and the nasal trigeminal chemosensory systems.Chem Senses. 2007 Sep;32(7):711-9. doi: 10.1093/chemse/bjm038. Epub 2007 Jun 14. Chem Senses. 2007. PMID: 17573355
-
The perception of odor is not a surrogate marker for chemical exposure: a review of factors influencing human odor perception.Clin Toxicol (Phila). 2013 Feb;51(2):70-6. doi: 10.3109/15563650.2013.767908. Clin Toxicol (Phila). 2013. PMID: 23387344 Review.
-
Higher Straight-Chain Aliphatic Aldehydes: Importance as Odor-Active Volatiles in Human Foods and Issues for Future Research.J Agric Food Chem. 2019 May 1;67(17):4720-4725. doi: 10.1021/acs.jafc.9b01131. Epub 2019 Apr 17. J Agric Food Chem. 2019. PMID: 30945546 Review.
Cited by
-
Formaldehyde and asthma: a plausibility?Arch Toxicol. 2025 Mar;99(3):865-885. doi: 10.1007/s00204-024-03946-5. Epub 2025 Jan 19. Arch Toxicol. 2025. PMID: 39828805 Review.
-
Bewertung von Geruchsstoffen in der Innenraumluft – Weiterentwicklung des Geruchsleitwerte-Konzeptes des AIR : Mitteilung des Ausschusses für Innenraumrichtwerte.Bundesgesundheitsblatt Gesundheitsforschung Gesundheitsschutz. 2023 Apr;66(4):452-459. doi: 10.1007/s00103-023-03682-8. Bundesgesundheitsblatt Gesundheitsforschung Gesundheitsschutz. 2023. PMID: 36995393 German. No abstract available.
-
Phytochemical Profile of Trigonella caerulea (Blue Fenugreek) Herb and Quantification of Aroma-Determining Constituents.Plants (Basel). 2023 Mar 3;12(5):1154. doi: 10.3390/plants12051154. Plants (Basel). 2023. PMID: 36904014 Free PMC article.
-
Predicting odor perceptual similarity from odor structure.PLoS Comput Biol. 2013;9(9):e1003184. doi: 10.1371/journal.pcbi.1003184. Epub 2013 Sep 12. PLoS Comput Biol. 2013. PMID: 24068899 Free PMC article.
-
Scents in the stack: olfactometric proficiency testing with an emission simulation apparatus.Environ Sci Pollut Res Int. 2018 Sep;25(25):24787-24797. doi: 10.1007/s11356-018-2515-z. Epub 2018 Jun 20. Environ Sci Pollut Res Int. 2018. PMID: 29926329 Free PMC article.
References
-
- Abraham MH. Scales of hydrogen bonding: their construction and application to physicochemical and biochemical processes. Chem Soc Rev. 1993;22:73–83.
-
- Abraham MH, Andonian-Haftvan J, Cometto-Muñiz JE, Cain WS. An analysis of nasal irritation thresholds using a new solvation equation. Fundam Appl Toxicol. 1996;31:71–76. - PubMed
-
- Abraham MH, Gola JRM, Cometto-Muñiz JE, Cain WS. The correlation and prediction of VOC thresholds for nasal pungency, eye irritation and odour in humans. Indoor Built Environ. 2001;10:252–257.
Publication types
MeSH terms
Substances
Grants and funding
LinkOut - more resources
Full Text Sources
Other Literature Sources
