

PTBP1-dependent regulation of USP5 alternative RNA splicing plays a role in glioblastoma tumorigenesis
- PMID: 21976412
- PMCID: PMC3319169
- DOI: 10.1002/mc.20859
PTBP1-dependent regulation of USP5 alternative RNA splicing plays a role in glioblastoma tumorigenesis
Abstract
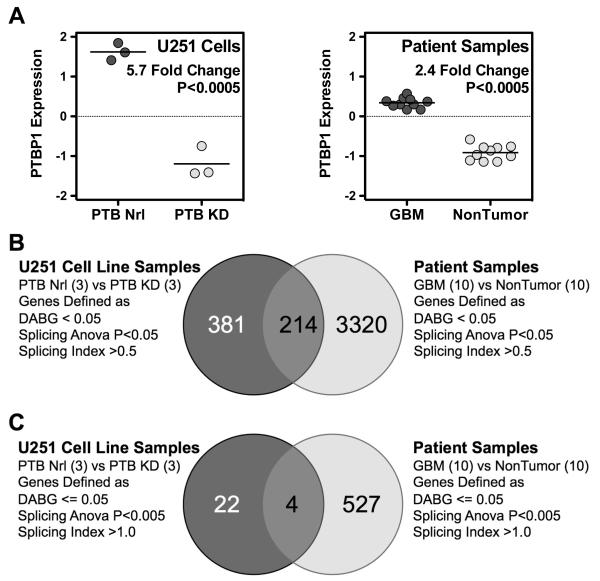
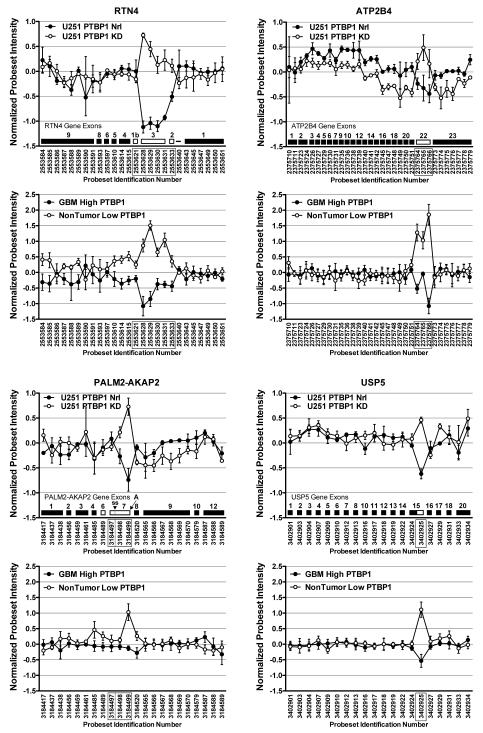
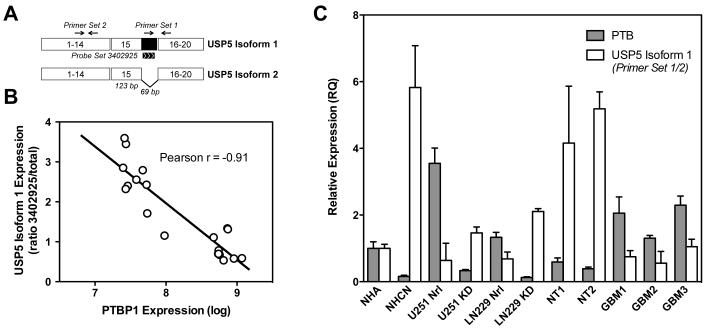
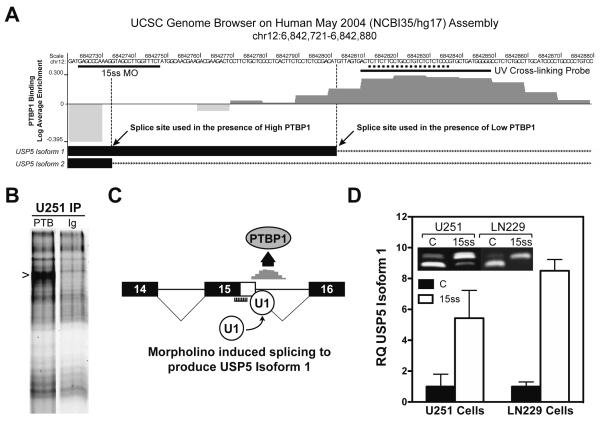
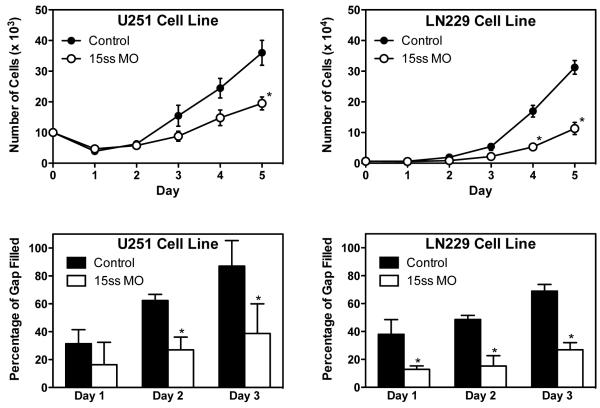
Aberrant RNA splicing is thought to play a key role in tumorigenesis. The assessment of its specific contributions is limited by the complexity of information derived from genome-wide array-based approaches. We describe how performing splicing factor-specific comparisons using both tumor and cell line data sets may more readily identify physiologically relevant tumor-specific splicing events. Affymetrix exon array data derived from glioblastoma (GBM) tumor samples with defined polypyrimidine tract-binding protein 1 (PTBP1) levels were compared with data from U251 GBM cells with and without PTBP1 knockdown. This comparison yielded overlapping gene sets that comprised only a minor fraction of each data set. The identification of a novel GBM-specific splicing event involving the USP5 gene led us to further examine its role in tumorigenesis. In GBM, USP5 generates a shorter isoform 2 through recognition of a 5' splice site within exon 15. Production of the USP5 isoform 2 was strongly correlated with PTBP1 expression in GBM tumor samples and cell lines. Splicing regulation was consistent with the presence of an intronic PTBP1 binding site and could be modulated through antisense targeting of the isoform 2 splice site to force expression of isoform 1 in GBM cells. The forced expression of USP5 isoform 1 in two GBM cell lines inhibited cell growth and migration, implying an important role for USP5 splicing in gliomagenesis. These results support a role for aberrant RNA splicing in tumorigenesis and suggest that changes in relatively few genes may be sufficient to drive the process.
Copyright © 2011 Wiley Periodicals, Inc.
Figures
Similar articles
-
Splicing factors PTBP1 and PTBP2 promote proliferation and migration of glioma cell lines.Brain. 2009 Aug;132(Pt 8):2277-88. doi: 10.1093/brain/awp153. Epub 2009 Jun 8. Brain. 2009. PMID: 19506066 Free PMC article.
-
Skipping of exon 10 in Axl pre-mRNA regulated by PTBP1 mediates invasion and metastasis process of liver cancer cells.Theranostics. 2020 Apr 27;10(13):5719-5735. doi: 10.7150/thno.42010. eCollection 2020. Theranostics. 2020. PMID: 32483414 Free PMC article.
-
SON drives oncogenic RNA splicing in glioblastoma by regulating PTBP1/PTBP2 switching and RBFOX2 activity.Nat Commun. 2021 Sep 21;12(1):5551. doi: 10.1038/s41467-021-25892-x. Nat Commun. 2021. PMID: 34548489 Free PMC article.
-
The Emerging Role of the RBM20 and PTBP1 Ribonucleoproteins in Heart Development and Cardiovascular Diseases.Genes (Basel). 2020 Apr 8;11(4):402. doi: 10.3390/genes11040402. Genes (Basel). 2020. PMID: 32276354 Free PMC article. Review.
-
The latest role of nerve-specific splicing factor PTBP1 in the transdifferentiation of glial cells into neurons.Wiley Interdiscip Rev RNA. 2023 Mar;14(2):e1740. doi: 10.1002/wrna.1740. Epub 2022 May 16. Wiley Interdiscip Rev RNA. 2023. PMID: 35574699 Review.
Cited by
-
RNA splicing factors as oncoproteins and tumour suppressors.Nat Rev Cancer. 2016 Jul;16(7):413-30. doi: 10.1038/nrc.2016.51. Epub 2016 Jun 10. Nat Rev Cancer. 2016. PMID: 27282250 Free PMC article. Review.
-
PTBP1-mediated repression of neuron-specific CDC42 splicing constitutes a genomic alteration-independent, developmentally conserved vulnerability in IDH-wildtype glioblastoma.Funct Integr Genomics. 2024 Aug 9;24(4):135. doi: 10.1007/s10142-024-01412-0. Funct Integr Genomics. 2024. PMID: 39117866
-
RNA-Binding Proteins in Cancer: Functional and Therapeutic Perspectives.Cancers (Basel). 2020 Sep 21;12(9):2699. doi: 10.3390/cancers12092699. Cancers (Basel). 2020. PMID: 32967226 Free PMC article. Review.
-
Most expression and splicing changes in myotonic dystrophy type 1 and type 2 skeletal muscle are shared with other muscular dystrophies.Neuromuscul Disord. 2014 Mar;24(3):227-40. doi: 10.1016/j.nmd.2013.11.001. Epub 2013 Nov 15. Neuromuscul Disord. 2014. PMID: 24332166 Free PMC article.
-
TGF-β1 Induces Polypyrimidine Tract-Binding Protein to Alter Fibroblasts Proliferation and Fibronectin Deposition in Keloid.Sci Rep. 2016 Nov 29;6:38033. doi: 10.1038/srep38033. Sci Rep. 2016. PMID: 27897224 Free PMC article.
References
-
- CBTRUS . Volume 2009. Central Brain Tumor Registry of the United States; 2009. http://www.cbtrus.org/
-
- Pan Q, Shai O, Lee LJ, Frey BJ, Blencowe BJ. Deep surveying of alternative splicing complexity in the human transcriptome by high-throughput sequencing. Nat Genet. 2008;40:1413–1415. - PubMed
Publication types
MeSH terms
Substances
Grants and funding
LinkOut - more resources
Full Text Sources
Research Materials
Miscellaneous
