Comparative Study
. 2011 Oct 5;31(40):14158-71.
doi: 10.1523/JNEUROSCI.2666-11.2011.

Regulation of neuronal M-channel gating in an isoform-specific manner: functional interplay between calmodulin and syntaxin 1A

Affiliations
Comparative Study

Regulation of neuronal M-channel gating in an isoform-specific manner: functional interplay between calmodulin and syntaxin 1A

Adi Etzioni et al. J Neurosci. .

Abstract

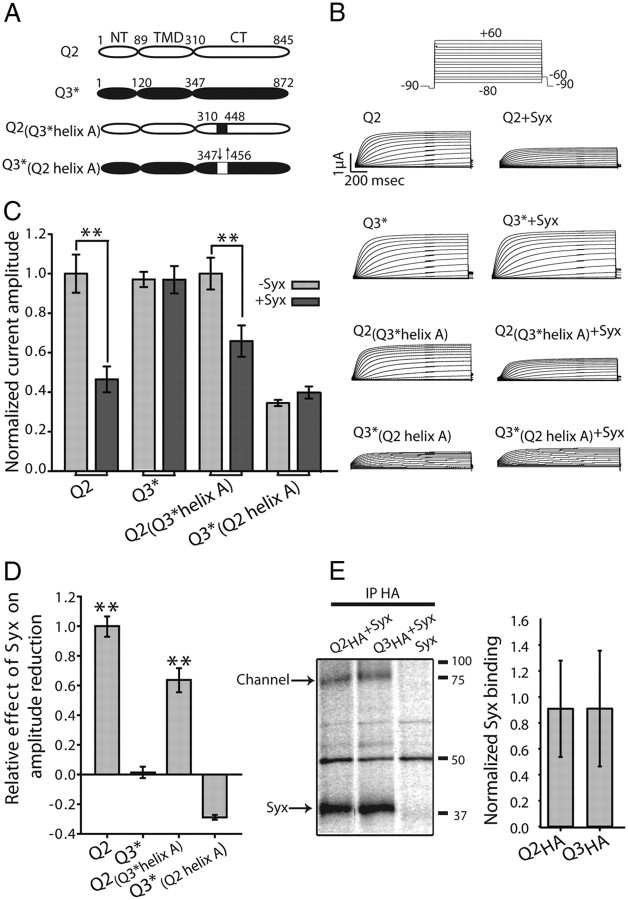
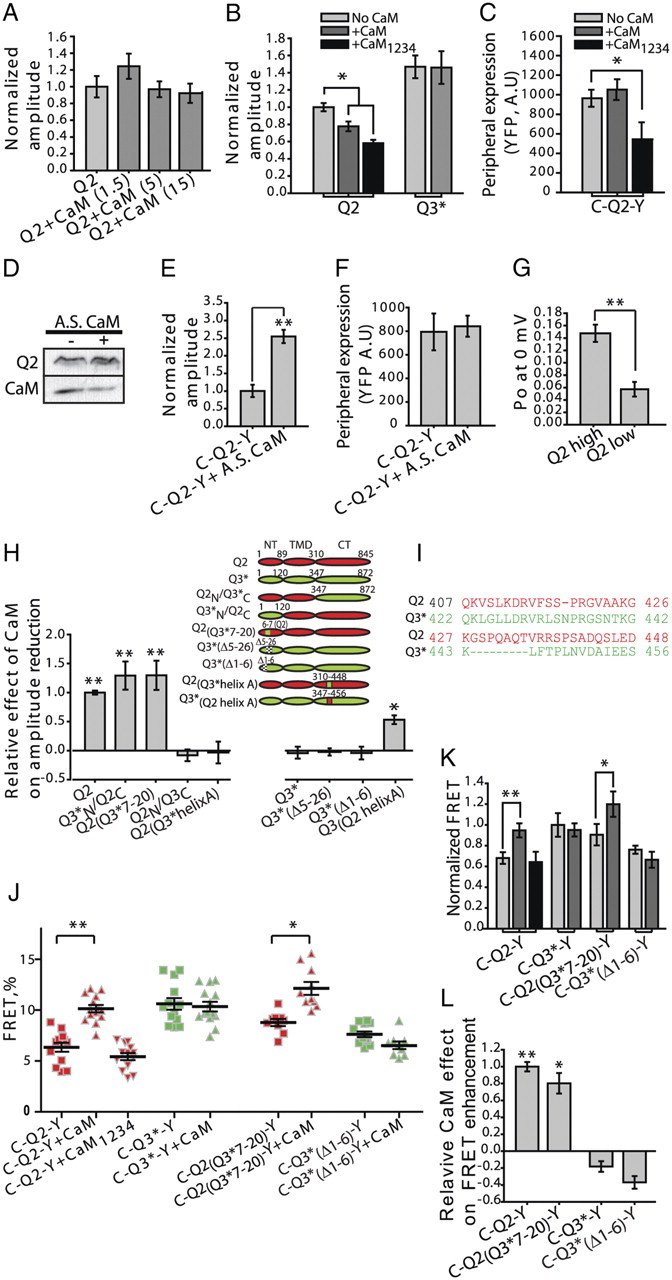
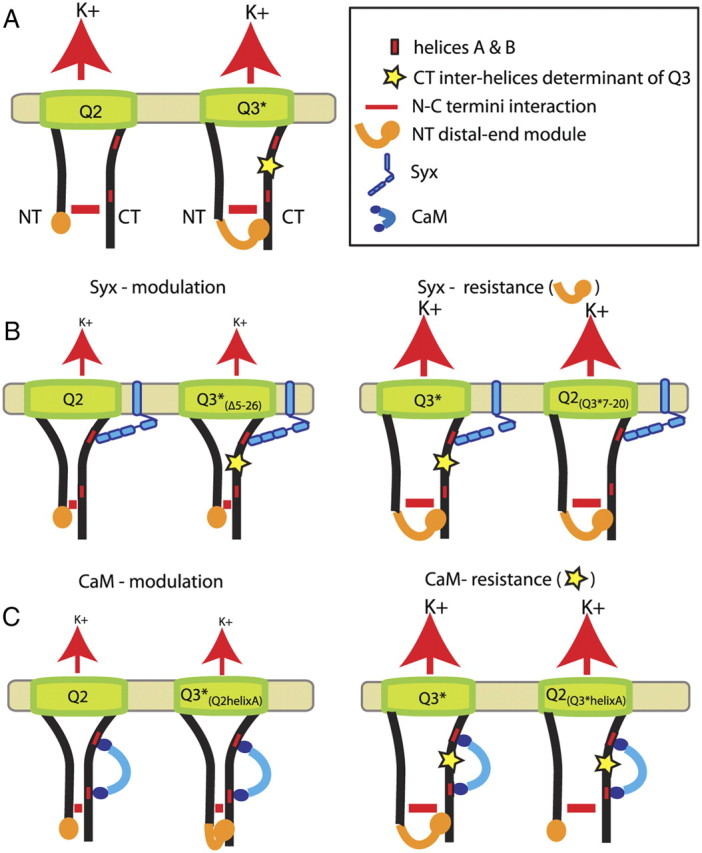
Whereas neuronal M-type K(+) channels composed of KCNQ2 and KCNQ3 subunits regulate firing properties of neurons, presynaptic KCNQ2 subunits were demonstrated to regulate neurotransmitter release by directly influencing presynaptic function. Two interaction partners of M-channels, syntaxin 1A and calmodulin, are known to act presynaptically, syntaxin serving as a major protein component of the membrane fusion machinery and calmodulin serving as regulator of several processes related to neurotransmitter release. Notably, both partners specifically modulate KCNQ2 but not KCNQ3 subunits, suggesting selective presynaptic targeting to directly regulate exocytosis without interference in neuronal firing properties. Here, having first demonstrated in Xenopus oocytes, using analysis of single-channel biophysics, that both modulators downregulate the open probability of KCNQ2 but not KCNQ3 homomers, we sought to resolve the channel structural determinants that confer the isoform-specific gating downregulation and to get insights into the molecular events underlying this mechanism. We show, using optical, biochemical, electrophysiological, and molecular biology analyses, the existence of constitutive interactions between the N and C termini in homomeric KCNQ2 and KCNQ3 channels in living cells. Furthermore, rearrangement in the relative orientation of the KCNQ2 termini that accompanies reduction in single-channel open probability is induced by both regulators, strongly suggesting that closer N-C termini proximity underlies gating downregulation. Different structural determinants, identified at the N and C termini of KCNQ3, prevent the effects by syntaxin 1A and calmodulin, respectively. Moreover, we show that the syntaxin 1A and calmodulin effects can be additive or blocked at different concentration ranges of calmodulin, bearing physiological significance with regard to presynaptic exocytosis.


Figures

Figure 1.
Figure 1.
Syx decreases Po of Q2 but not Q3*. A, Single-channel activity elicited by voltage steps from −90 to 0 mV from oocyte patches containing a single Q2 or Q3* channel expressed alone or with Syx (+Syx). B, C, All-point amplitude histograms from the sweeps shown in A for Q2 and for Q3*, respectively, alone or with Syx, fitted by a double-Gaussian curves (smooth lines). The closed-state peak has been set to 0 pA. D, Mean amplitudes (i) of Q2 and Q3*, alone or coexpressed with Syx (n = 9–16 patches). E, Po values of Q2 and Q3* averaged from patches containing one to three channels, alone or coexpressed with Syx (n = 9–16 patches per group). F, Normalized Po obtained from cumulative histograms of first latency (with 5 ms bins) derived from analysis of >70 sweeps from Q2 and ∼140 sweeps from Q2 coexpressed with Syx. G, MFL time values; equal number of sweeps as in F. *p < 0.05; **p < 0.01. Error bars indicate SEM.
Figure 2.
Figure 2.
The selective effect of Syx on Q2 but not on Q3* current amplitude is not due to different Syx binding capacities. A, Schematic representations of Q2 (white) and Q3* (black) and a pair of chimeras with exchanged helix A domains. B, Representative current traces of the channels, alone or coexpressed with Syx, in oocytes of the same batch. Inset, Experimental protocol. C, Normalized averaged current amplitudes, evoked by a voltage step from a holding potential of −90 to +5 mV, of the WT and chimeric channels, alone or coexpressed with Syx (n = 25–35; N = 4). D, Relative effect of Syx on current amplitudes, quantified as the fraction of current amplitude reduced in the presence of Syx, normalized to the fraction reduced by Syx in Q2 (derived from data shown in C; see Materials and Methods). E, Syx coprecipitates equally well with HA-tagged Q2 and Q3* channels, using anti-HA antibody. Left, Digitized PhosphorImager scan of a SDS-PAGE of [35S]Met/Cys-labeled channels and Syx co-IPed, using anti-HA antibody (IP HA), from homogenates of oocytes of a single batch expressing Q2HA, Q3*HA, Syx, or both, as denoted above the lanes. Right, Normalized Syx binding calculated as band intensity ratio of Syx to channel (arbitrary units quantitated by ImageQuant; N = 3). **p < 0.01. Error bars indicate SEM.
Figure 3.
Figure 3.
The effects of Syx on current amplitude of Q2 and Q3* are dependent on the NT distal-end parts of the channels. A, Top panel, Schematic representation of Q2 (white) and Q3* (black) chimeras. Q2(Q3*7–20), Glycine-rich motif (amino acids 7–20) of Q3 inserted between amino acids 6–7 of Q2; Q3*(Δ5–26), 21 aa (5–26) deleted from Q3* (checkered); Q3*(Δ1–6), first 6 aa deleted from Q3*. Bottom panel, Alignment of the NT distal-end parts of Q2 and Q3 shows a glycine-rich 14 aa stretch in Q3 that is missing in Q2. Alignment was performed using CLUSTAL W (1.83) multiple sequence alignment. B, Left, Loss of Syx function to reduce current amplitude is dependent on changes in Q2 NT distal-end part, and not its CT. Right, Gain of Syx function to reduce current amplitude in Q3* is dependent on changes in Q3 NT distal-end parts. Shown are relative effects of Syx (quantified as in Fig. 2D) on the different chimeras shown in A (n = 9–57; N = 1–5). C, Syx coprecipitates equally well with all HA-tagged Q2 and chimeric channels from oocytes coexpressing the channels with Syx, using anti-HA antibody, performed as in Figure 2E. *p < 0.05; **p < 0.01. Error bars indicate SEM.
Figure 4.
Figure 4.
NT distal-end parts control the effect of Syx on Po. A, C, E, Single-channel recordings performed as in Figure 1 from oocyte patches containing single Q2(Q3*7–20) (A), Q3*(Δ5–26) (C), or Q3*(Δ1–6) (E) channels, alone or together with Syx (+Syx). B, D, F, Corresponding Po values averaged from patches containing one to three channels (n = 5–8). *p < 0.05. Error bars indicate SEM.
Figure 5.
Figure 5.
FRET and biochemical analyses demonstrate N–C termini direct interactions in Q2 and Q3*; the interactions are different and are regulated by NT distal-end parts. A, Double fluorescence labeling of Q2 and Q3* does not impair voltage sensitivity. Oocytes were injected with WT (red) Q2 (left) or Q3*(right) mRNAs or double fluorescent-labeled channels (blue) C-Q2-Y (left) or C-Q3*-Y (right) mRNAs. Normalized conductance (G/Gmax)–voltage (V) relationships were derived from current–voltage relationships obtained from leak subtracted peak currents elicited by 1.5 s steps to the denoted potential (with 5 s intervals between episodes); half-activation voltages (Va1/2) and activation slope factors (Ka) derived from exponential curve fitting (Fit) of WT and fluorescent labeled channels are denoted. N = 2; n = 12–18. B, Confocal images of two representative oocytes in a frame expressing the different fluorescent-labeled channels [denoted above the images with eCFP (blue star) and/or eYFP (yellow star) decorations] excited with 405 nm or with 514 nm laser excitations. Note the very weak emission of Q2-eYFP (Q2-Y) caused by 405 nm excitation (c). The lighter blue shade of image e, in comparison with image a, and even lighter blue shade of image g in comparison with images a and e, are indicative of FRET. C, Emission spectra of eCFP only (blue), C-Q2-Y (red), C-Q3*-Y (green), or C-Syx (eCFP inserted at the N terminus of Syx) with Kv2.1ΔC1a-Y (a Kv2.1 channel mutant with deleted C1a domain with eYFP inserted at its C terminus; purple). Oocytes were excited at 405 nm and the resulting spectra were normalized to the peak eCFP emission (481 nm). D, FRET between N and C termini of C-Q2-Y, C-Q3*-Y, and the chimeras C-Q2(Q3*7–20)-Y and C-Q3*(Δ1–6)-Y, in which the GR motif was exchanged. FRET between C-Syx and Kv2.1Δ331-Y (a Kv2.1 channel mutant with eYFP inserted downstream to the C-terminal C1a domain, which binds Syx) serves as a positive control. No significant FRET between C-Syx and Kv2.1ΔC1a-Y (a Kv2.1 mutant with deleted C1a domain and eYFP inserted at its C terminus) serves as a negative control. The results shown are pooled from two to nine similar independent experiments (n = 19–60). E, Averaged FRETs (derived from the data presented in D) normalized to that of C-Q3*-Y. F, Direct N–C termini interaction demonstrated by Western blot analysis of Q2 recombinant CT (synthesized with CaM) pulled down by Q2 or Q3 GST-NTs. Eluted proteins were separated by SDS-PAGE and either immunoblotted (IB) with anti-Q2 or anti-CaM antibodies to show the bound proteins (top panels) or stained with Coomassie Blue (CB) to show the GST proteins (bottom panel). **p < 0.01. Error bars indicate SEM.
Figure 6.
Figure 6.
Syx affects the N–C FRET of double fluorescent-labeled Q2 and Q3*; the effects are different and are determined by NT distal-end parts, similarly to the effects on the corresponding current amplitudes. A, B, Syx reduces the FRET in C-Q3*-Y and increases that of C-Q2-Y; changes in the NTs (C-Q2(Q3*7–20)-Y and C-Q3*(Δ1–6)-Y) reverse the effects of Syx. Oocytes were injected with the mRNAs of each of the channels, alone or with Syx. Shown are FRETs of one representative experiment (n = 10–16; A) and averaged FRETs, normalized to that of C-Q3*-Y, pooled from one to three similar experiments (n = 6–38; B). C, D, Relative effect of Syx on FRET enhancement (quantified as the fraction of FRET enhanced in the presence of Syx, normalized to fraction enhanced by Syx in Q2; C) and on current amplitude reduction (quantified as the fraction of current amplitude reduced in the presence of Syx, normalized to the fraction reduced by Syx in Q2; D), assayed in the same oocytes. Note the correlation between the relative effects of Syx in C and D. **p < 0.01. Error bars indicate SEM.
Figure 7.
Figure 7.
CaM decreases the current amplitudes of Q2 but not of Q3* and increases the FRET between the N and C termini of double fluorescent-labeled Q2 but not Q3*. The effect is dependent on the CT and not on the NT distal-end parts. A, At a standard channel expression level, CaM does not reduce Q2 currents. Oocytes were injected with Q2 (standard concentrations, 7.5 ng/oocyte), alone or together with increasing concentrations (1.5, 5, or 15 ng/oocyte) of CaM. Currents were evoked by a voltage step from a holding potential of −90 to +5 mV (n = 17–21; N = 2). B, At a high channel expression level, CaM and CaM1234 reduce the current amplitudes of Q2 but not of Q3*. Oocytes were injected with Q2 (20 ng/oocyte) or Q3* (2 ng/oocyte) mRNAs, alone or together with equal amounts of CaM or CaM1234 mRNAs (n = 9–35; N = 1–3). C, CaM1234, but not CaM, reduces C-Q2-Y peripheral expression. Peripheral levels were measured from confocal images of oocytes, taken under 514 nm laser excitations, in whole oocytes expressing C-Q2-Y, alone or together with CaM or CaM1234 (n = 15). D, Endogenous CaM levels are knocked down in oocytes that were injected with antisense oligodeoxynucleotide targeted against CaM (A.S. CaM) 1 d before the channel injection and every 48 h until the assay. Western blot analysis of C-Q2-Y (top panel) and CaM (bottom panel) from homogenates of oocytes injected with C-Q2-Y, alone or together with A.S. CaM, was performed using antibodies against Q2 or CaM, respectively. C-Q2-Y expression levels were not reduced. E, Antisense knockdown of endogenous CaM increases current amplitudes in oocytes expressing C-Q2-Y (45 ng/oocyte) injected with antisense oligodeoxynucleotide targeted against CaM (A.S. CaM) 1 d before the channel injection and every 48 h until the assay. Currents were evoked by a voltage step from a holding potential of −90 to +5 mV. F, Peripheral levels of C-Q2-Y measured from confocal images taken under 514 nm laser excitations, in oocytes expressing C-Q2-Y, alone or together with A.S. CaM are similar (n = 7; same oocytes in E and F). G, Po values averaged from patches of oocytes injected with high (25 ng/oocyte) or low (2.5 ng/oocyte) Q2 mRNA. Patches contained one to three channels (n = 8–13). H, The relative effect of CaM on reduction of current amplitudes (quantified as the fraction of current reduced in the presence of CaM, normalized to the fraction reduced by CaM in Q2) is independent of the NT distal-end parts, but is dependent on the CT, in contrast to Syx (n = 10–35; N = 1–3). Left, The effect of CaM on Q2 current amplitudes is resistant to changes in Q2NT but is lost upon exchange of Q2CT with Q3*CT; specifically, it is lost by swapping of the helix A domains. Right, Q3* does not gain CaM function by changes in its NT but only by exchange of its helix A with that of Q2. Inset, Schematic representations of Q2, Q3*, and the chimeras. I, Alignment of Q2 (red) and Q3 (green) CT regions responsible for the isoform-specific effect of CaM. J–L, CaM, but not CaM1324, increases the FRET in C-Q2-Y, but not in C-Q3*-Y. The CaM-induced increase in FRET is independent of the NT distal-end parts, in contrast to Syx. Shown are a representative experiment showing FRETs in the absence and presence of CaM or CaM1234 (J; n = 8–15); data were pooled from three experiments (n = 10–46) as in J, plotted as averaged FRETs that are normalized to that of C-Q3*-Y (K), and as relative effects of CaM on FRET enhancement (quantified as the fraction of FRET enhanced in the presence of CaM, normalized to that of Q2; L). Note the correlation between the relative effects of CaM on FRET (L) and on current amplitude (H). *p < 0.05; **p < 0.01. Error bars indicate SEM.
Figure 8.
Figure 8.
Coexpression of CaM with Syx results in elimination of the effect of Syx on current amplitude, Po, and N–C interaction. A, Syx enhances the binding of CaM to the channel. Left, Digitized PhosphorImager scan of a coimmunoprecipitation analysis by SDS-PAGE of [35S]Met/Cys-labeled Q2, Syx, and CaM, using antibody against Q2, from homogenates of oocytes of a single frog injected with Q2, alone or in combination with Syx and/or CaM, mRNAs, as denoted above the lanes. The results shown are from one of three similar independent experiments. Middle and right, Summarized data of normalized CaM and Syx bindings, respectively, from three independent experiments. The bars depict band intensity ratios (quantified by ImageQuant) of CaM or Syx, coprecipitated with Q2, to precipitated Q2. B, In the presence of CaM or CaM1234, the effect of Syx on Q2 current amplitude is blocked. Shown are the effects of Syx on current amplitudes in oocytes injected with Q2 (20 ng/oocyte) together with Syx, alone or in combination with CaM or CaM1234 (as depicted below the bars), relative to that in oocytes injected with Q2 and Syx. Currents were evoked by a voltage step from a holding potential of −90 to +5 mV. C, In the presence of CaM or CaM1234, the effect of Syx on Q2 Po is blocked. Shown are the effects of Syx on Po values derived from analysis of patches (containing 1–3 channels) of oocytes injected with Q2 together with Syx, alone or in combination with CaM (as depicted below the bars) relative to that in oocytes injected with Q2 and Syx (n = 8–10). D, In the presence of CaM or CaM1234, the effect of Syx on FRET of C-Q2-Y is blocked (n = 10–24; N = 1–2). Shown are the effects of Syx on FRETs in oocytes injected with Q2 together with Syx, alone or in combination with CaM or CaM1234 (as depicted below the bars), relative to that in oocytes injected with Q2 and Syx. E, In the presence of CaM or CaM1234, the effect of Syx on Q3*(Δ5–26) (2 ng/oocyte) current amplitudes is blocked. Experimental and presentation details are as in B. **p < 0.01. Error bars indicate SEM.
Figure 9.
Figure 9.
A–C, Model depicting N–C interactions, constitutive and corresponding to gating modulations by Syx and CaM. A, Q2 and Q3 (helices C and D in the CTs were omitted for clarity) carry constitutive N–C interactions, inter or intra subunit. The interactions consist of a basal interaction, probably common to both channels (red horizontal lines) and an additional interaction in Q3 formed by the NT distal-end module (orange). B, C, Modulations by Syx (B, left) or CaM (C, left) bindings involve closer N–C proximity, accompanied by a decrease in Po (depicted by smaller vertical red arrows of K+ fluxes). Resistance to Syx (B, right) or CaM (C, right) modulations is conferred by a Q3-specific NT (orange) or CT (yellow star) determinants, respectively.

Similar articles

Cited by

References

    1. Bal M, Zaika O, Martin P, Shapiro MS. Calmodulin binding to M-type K+ channels assayed by TIRF/FRET in living cells. J Physiol. 2008;586:2307–2320. - PMC - PubMed
    1. Biervert C, Schroeder BC, Kubisch C, Berkovic SF, Propping P, Jentsch TJ, Steinlein OK. A potassium channel mutation in neonatal human epilepsy. Science. 1998;279:403–406. - PubMed
    1. Bofill-Cardona E, Kudlacek O, Yang Q, Ahorn H, Freissmuth M, Nanoff C. Binding of calmodulin to the D2-dopamine receptor reduces receptor signaling by arresting the G protein activation switch. J Biol Chem. 2000;275:32672–32680. - PubMed
    1. Bright JN, Sansom MSP. The flexing/twirling helix: exploring the flexibility about molecular hinges formed by praline and glycine motifs in transmembrane helices. J Phys Chem B. 2003;107:627–636.
    1. Brown DA, Adams PR. Muscarinic suppression of a novel voltage-sensitive K+ current in a vertebrate neurone. Nature. 1980;283:673–676. - PubMed

Publication types

MeSH terms