Comparative Study
. 2011 Oct 5;31(40):14223-34.
doi: 10.1523/JNEUROSCI.3157-11.2011.

Altered neocortical rhythmic activity states in Fmr1 KO mice are due to enhanced mGluR5 signaling and involve changes in excitatory circuitry

Affiliations
Comparative Study

Altered neocortical rhythmic activity states in Fmr1 KO mice are due to enhanced mGluR5 signaling and involve changes in excitatory circuitry

Seth A Hays et al. J Neurosci. .

Abstract

Despite the pronounced neurological deficits associated with mental retardation and autism, the degree to which neocortical circuit function is altered remains unknown. Here, we study changes in neocortical network function in the form of persistent activity states in the mouse model of fragile X syndrome--the Fmr1 knock-out (KO). Persistent activity states, or UP states, in the neocortex underlie the slow oscillation which occurs predominantly during slow-wave sleep, but may also play a role during awake states. We show that spontaneously occurring UP states in the primary somatosensory cortex are 38-67% longer in Fmr1 KO slices. In vivo, UP states reoccur with a clear rhythmic component consistent with that of the slow oscillation and are similarly longer in the Fmr1 KO. Changes in neocortical excitatory circuitry likely play the major role in this alteration as supported by three findings: (1) longer UP states occur in slices of isolated neocortex, (2) pharmacologically isolated excitatory circuits in Fmr1 KO neocortical slices display prolonged bursting states, and (3) selective deletion of Fmr1 in cortical excitatory neurons is sufficient to cause prolonged UP states whereas deletion in inhibitory neurons has no effect. Excess signaling mediated by the group 1 glutamate metabotropic receptor, mGluR5, contributes to the longer UP states. Genetic reduction or pharmacological blockade of mGluR5 rescues the prolonged UP state phenotype. Our results reveal an alteration in network function in a mouse model of intellectual disability and autism which may impact both slow-wave sleep and information processing during waking states.


Figures
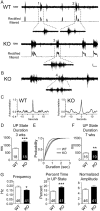
Figure 1.
Figure 1.
Spontaneously occurring persistent activity states, or UP states, are longer in layer 4 of Fmr1 KO somatosensory cortical slices. A, Examples of extracellular multiunit recordings from WT and KO slices demonstrate longer UP states in the KO. The rectified and filtered versions of the traces from which the UP states were analyzed are plotted underneath. Dashed lines indicate shorter epochs of the longer traces which are expanded to show more detail. B, In some instances, UP states occurred in the form of closely spaced events, or bursts. These were considered one UP state (numbers 2 and 4 in A and B; see Materials and Methods). C, Autocorrelograms from the examples in A reveal some rhythmic activity, but in general it was weak (see Materials and Methods for details of autocorrelograms). D, Average UP state duration over all slices was higher in KO slices at 3 weeks of age. E, The average cumulative distribution of duration in a single slice (normalized for each slice and averaged over slices; same dataset as C; see Materials and Methods) was evenly shifted to the right for the KO. Outer dashed lines represent the SE. F, Average UP state duration was still longer at 7 weeks of age. G, UP state frequency was decreased and percentage of time in the UP state increased. *p < 0.05, **p < 0.01, ***p < 0.001. Calibrations: Vertical (in μV), raw traces, 20; rectified, 0.1. Horizontal (in ms), long traces, 1500; short traces, 300. Numbers inside bars indicate slice number in all figures except Figures 3 and 6D.
Figure 2.
Figure 2.
Spontaneously occurring UP states are longer in layer 5. A, Examples of simultaneous multiunit recordings of layers 4 (L4) and 5 (L5) in a WT and a KO slice. B, The longer duration phenotype in Fmr1 KO slices also exists to the same extent in both layers 4 and 5. C, Scatter plots depicting UP state durations measured in a single experiment from a WT and a KO slice. Each point represents the duration of a single UP state measured simultaneously in layer 4 and 5. Note the strong correlation. D, A picture depicting a slice that was used for recording from deep neocortical layers in isolation. Gray shading indicates regions removed. E, UP states recorded in layer 5 of slices containing only deep layers. F, Isolated deep layers of neocortex display longer UP states in Fmr1 KO slices. *p < 0.05, ***p < 0.001. Calibrations: (A) 30 μV, 5 s; (E) 30 μV, 1 s.
Figure 3.
Figure 3.
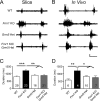
UP states are longer in Fmr1 KO mice, in vivo. A, Examples of multiunit recordings from single WT and KO mice, in vivo. B, Average duration of UP states is longer in Fmr1 KO mice (numbers inside bars indicate mouse number). An average cumulative histogram (right) indicates an even shift in durations across all animals (normalized for each mouse and averaged over mice, same dataset as bar graph to the left; see Materials and Methods). Outer dashed lines are SE. C, The frequency of UP states was not detectably different. D, Autocorrelations of the filtered, rectified traces depicted in A reveal a clear rhythmic component of the activity probably reflecting the slow oscillation (see Materials and Methods for details of autocorrelograms). Examples of first and second side-peaks are marked by arrows. *p < 0.05. Calibrations: 50 μV, 3 s.
Figure 4.
Figure 4.
Pharmacologically isolated excitatory circuitry displays longer persistent activity bursts in Fmr1 KO slices. A, Traces of prolonged bursts of activity collected during application of the GABAA antagonist, picrotoxin, and the GABAB receptor antagonist, CGP55845. B, The average duration of the bursts was longer in Fmr1 KO slices. C, The time course of the effect of GABA receptor blockade during 2 individual experiments. Antagonists are actually in the bath solution at time 0, but takes 12–18 min to reach the slice. Therefore, the upper bars depict the estimated time that the antagonists reach the slice. D, Average time course of the effects of GABA receptor blockade. The onset of the effects is not as sharp as individual examples in C because of variability in the time that the antagonists reach the slice preparation. The sample number in D is less than that in B because only a subset of the slices were monitored before and after antagonist application. *p < 0.05, **p < 0.01, ***p < 0.001. In D, repeated-measures ANOVA and Bonferroni corrections were used. Calibrations: 50 μV, 5 s.
Figure 5.
Figure 5.
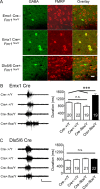
UP states are longer due to deletion of Fmr1 in neocortical excitatory neurons. A, Immunohistochemistry for GABA (green) and FMRP (red) shows that FMRP is expressed in both inhibitory and excitatory neurons in control animals (top row), FMRP is deleted only in excitatory neurons when recombination occurs in Emx1 Cre+:floxed Fmr1 mice (middle row), and FMRP is deleted only in inhibitory neurons when recombination occurs in Dlx5/6 Cre+:floxed Fmr1 mice (bottom row). B, UP state duration is longer in slices where FMRP was deleted only in cortical excitatory neurons (black bar), thereby recapitulating the phenotype of the constitutive Fmr1 KO. The large triangular bar indicates that the “recombined” genotype is different from all of the 3 nonrecombinant controls. C, Deletion of FMRP in inhibitory neurons did not affect UP state duration (black bar). ***p < 0.001. n.s., not significant. Calibrations: (B, C) 50 μV, 1 s.
Figure 6.
Figure 6.
Genetic reduction of mGluR5 protein rescues UP state duration in Fmr1 KO slices. A, B, Examples of traces from WT and Fmr1 KO slices (A) and mice (B, in vivo) on a WT Grm5 background (top two traces) and on a heterozygous Grm5 background (bottom two traces). C, D, Combination of Fmr1 KO and Grm5 heterozygosity (gray) restores UP state duration to WT levels. Grm5 heterozygosity on a WT background has no effect on UP state duration. The large triangular bar indicates that the KO duration is different from that of both WT and KO on the Grm5 heterozygous background. *p < 0.05, **p < 0.01, ***p < 0.001. Calibrations: 50 μV, 1 s.
Figure 7.
Figure 7.
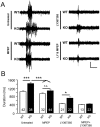
Pretreatment with an mGluR5 antagonist rescues UP state duration in Fmr1 KO slices. A, Examples of multiunit recordings from untreated slices and from slices after 45 min preincubation with an mGluR5 selective antagonist (MPEP, 10 μm) or an mGluR1 selective antagonist (LY367385, 100 μm). B, Summary of the effects of pretreatment on UP state duration. MPEP rescued the duration phenotype by equalizing the WT and KO UP state durations to normal WT levels. In contrast, while LY367385 significantly decreased duration in both WT and KO slices, UP states were still longer in the KO. The large triangular bar indicates that the untreated KO duration is different from that of both MPEP-treated genotypes. **p < 0.01, ***p < 0.001. n.s., not significant. Calibrations: 50 μV, 1 s.
Figure 8.
Figure 8.
Pretreatment with a protein translation inhibitor has no effect on WT or Fmr1 KO UP state duration. A, Examples of multiunit recordings from untreated slices and from slices after 45 min preincubation with anisomycin (20 μm). B, While UP state duration was longer in KO slices, durations were not affected by anisomycin treatment. **p < 0.01. Calibrations: 50 μV, 1 s.
Figure 9.
Figure 9.
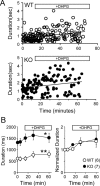
A group 1 mGluR agonist lengthens UP state duration in both WT and KO slices. A, UP state duration plotted as a function of time for 1 WT and 1 KO experiment where DHPG was applied. DHPG is added to ACSF at the 5 min time point, but the bars above the graphs depict the estimated time that DHPG reaches the slice (same applies to B). Trendline indicates time course average. B, Average time course for DHPG effect on UP state duration over all experiments plotted with raw durations (left) and durations normalized to the 0 min time point (right). *p < 0.05, **p < 0.01. p-values refer to an effect on duration by time (repeated-measures ANOVA).

Similar articles

Cited by

References

    1. Agmon A, Connors BW. Thalamocortical responses of mouse somatosensory (barrel) cortex in vitro. Neuroscience. 1991;41:365–379. - PubMed
    1. Amzica F, Steriade M. Cellular substrates and laminar profile of sleep K-complex. Neuroscience. 1998;82:671–686. - PubMed
    1. Bagni C, Greenough WT. From mRNP trafficking to spine dysmorphogenesis: the roots of fragile X syndrome. Nat Rev Neurosci. 2005;6:376–387. - PubMed
    1. Bassell GJ, Warren ST. Fragile X syndrome: loss of local mRNA regulation alters synaptic development and function. Neuron. 2008;60:201–214. - PMC - PubMed
    1. Bear MF, Huber KM, Warren ST. The mGluR theory of fragile X mental retardation. Trends Neurosci. 2004;27:370–377. - PubMed

Publication types

MeSH terms

Substances

LinkOut - more resources