Comparative Study
. 2011 Oct 5;31(40):14346-60.
doi: 10.1523/JNEUROSCI.3299-11.2011.

Annexin A2 promotes glioma cell invasion and tumor progression

Affiliations
Comparative Study

Annexin A2 promotes glioma cell invasion and tumor progression

Haiyan Zhai et al. J Neurosci. .

Abstract

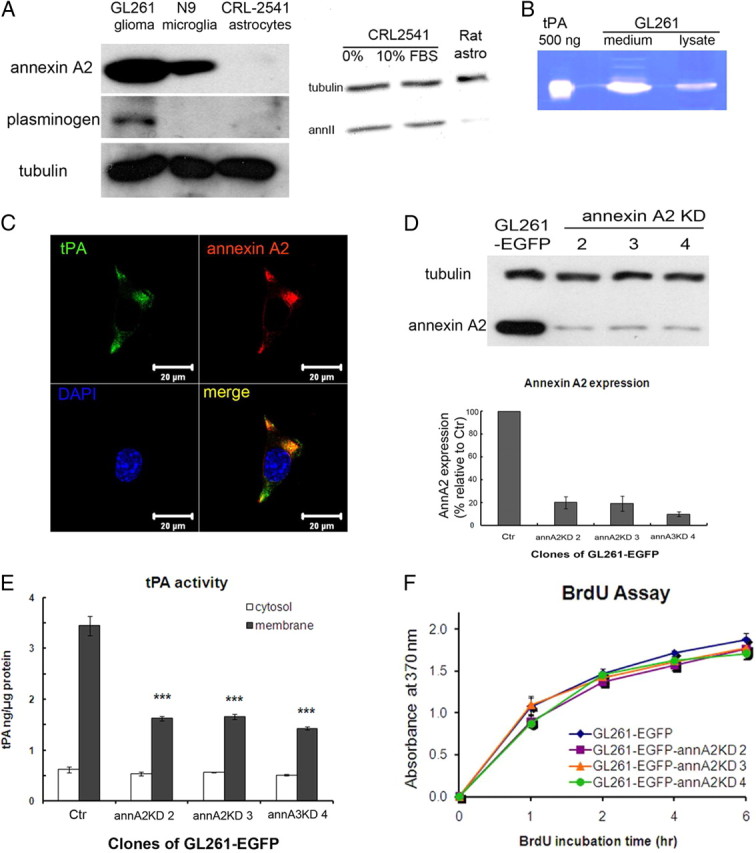
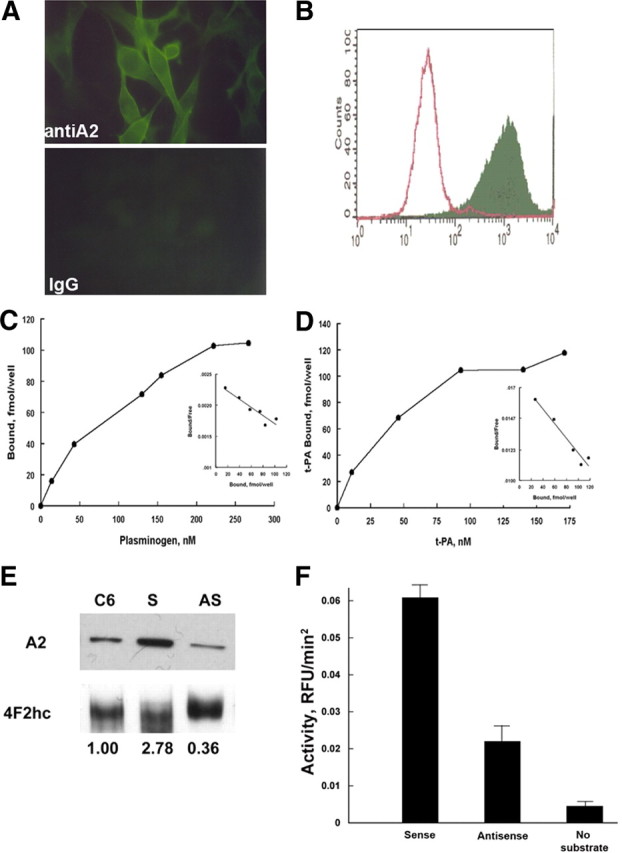
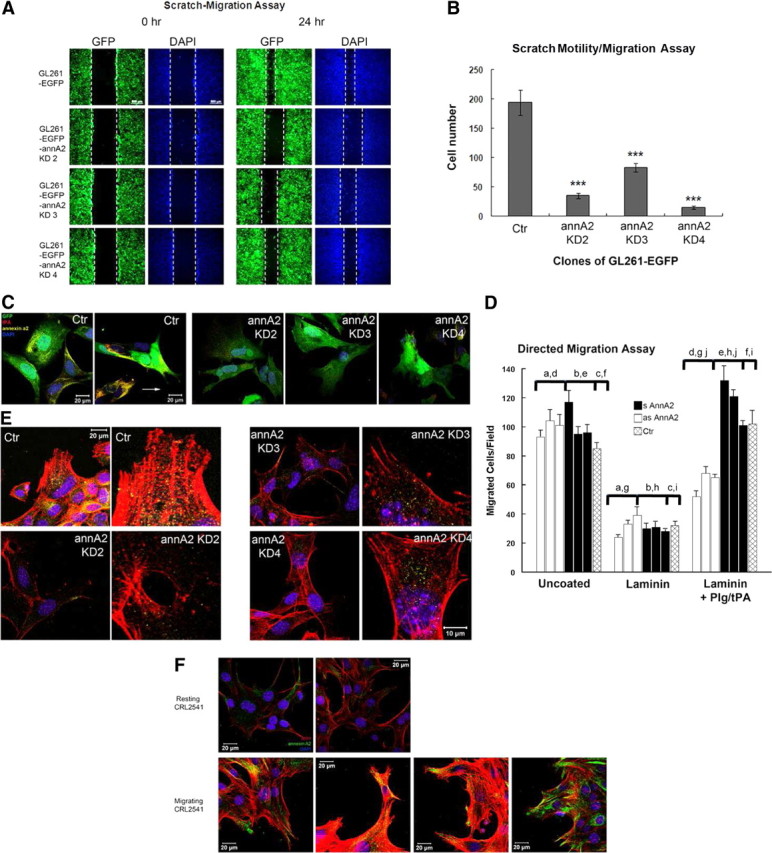
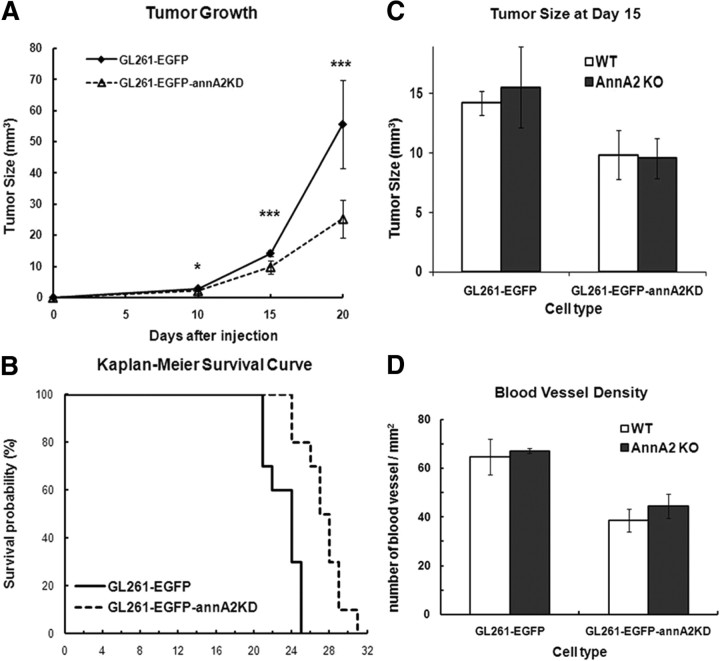
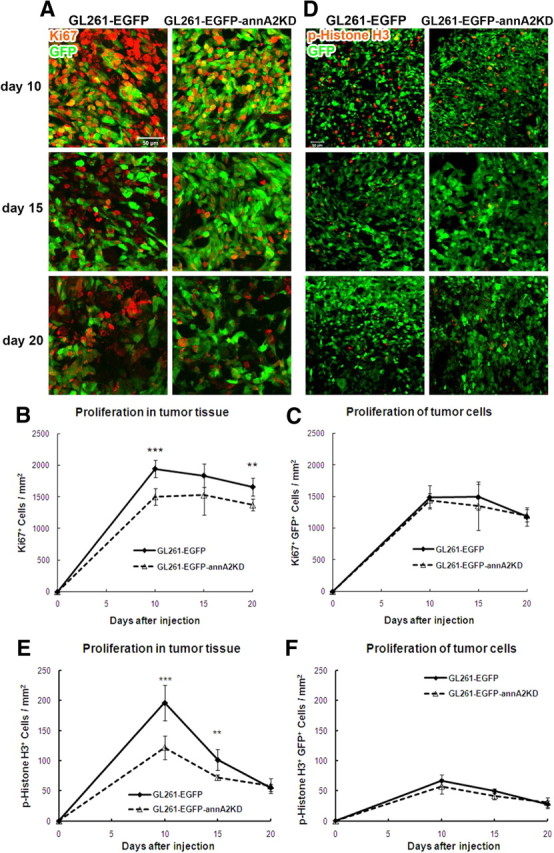
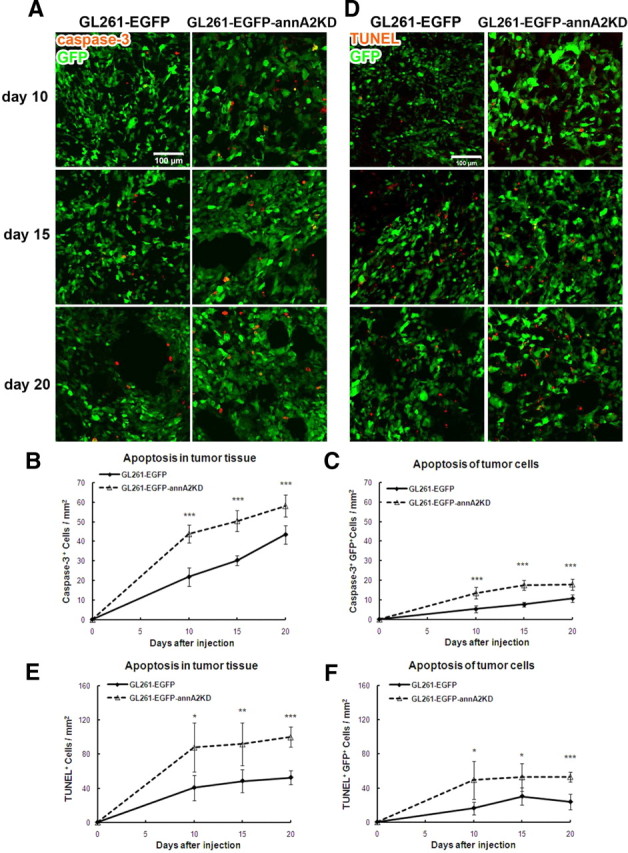
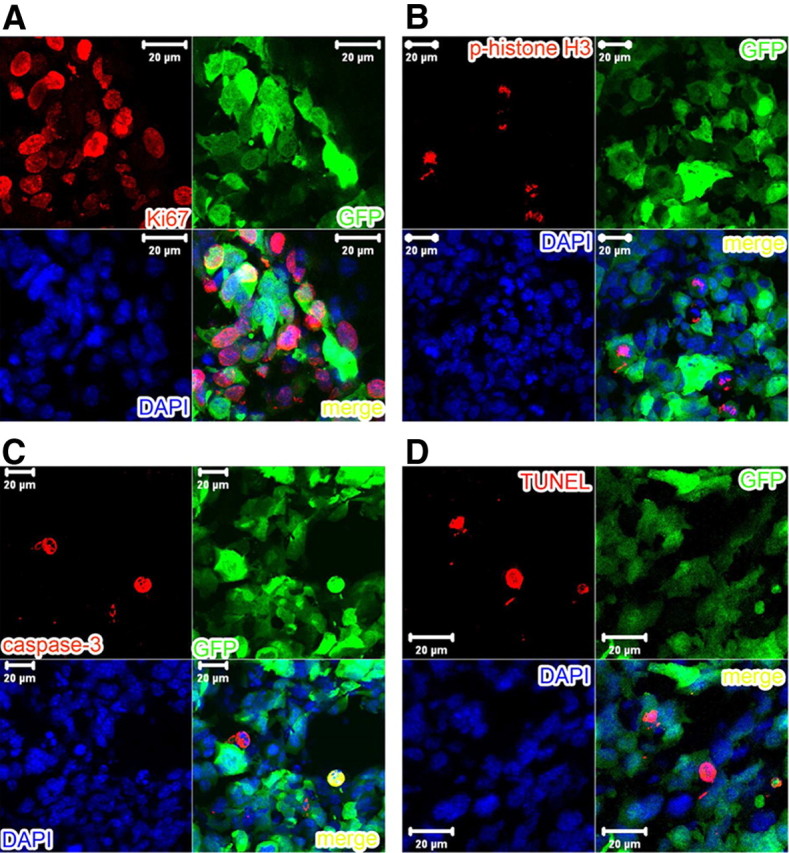
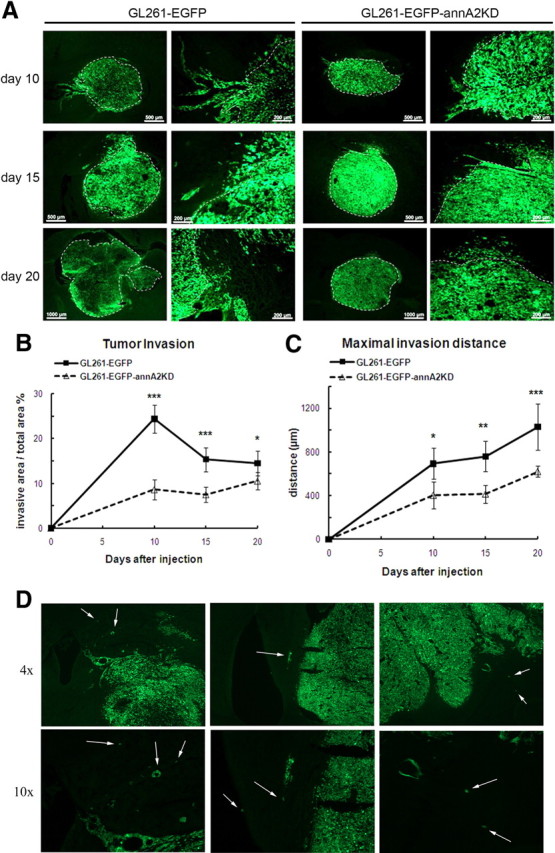
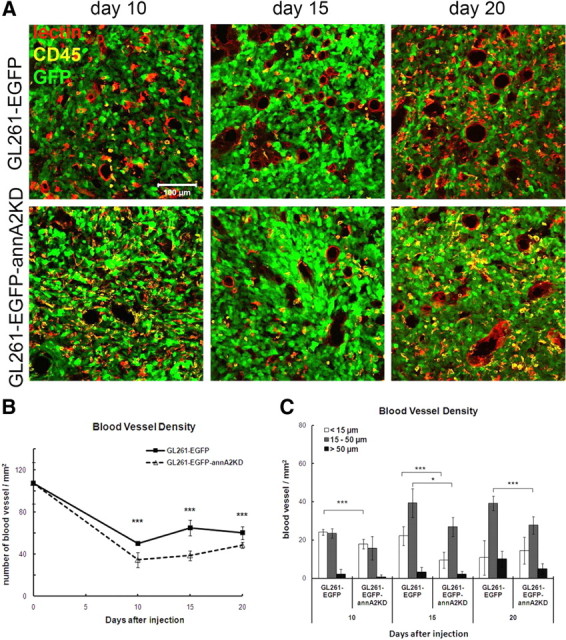
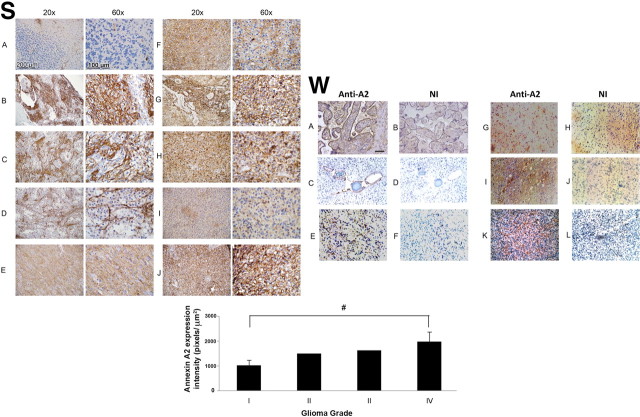
Gliomas are highly invasive, lethal brain tumors. Tumor-associated proteases play an important role in glioma progression. Annexin A2 is overexpressed in many cancers and correlates with increased plasmin activity on the tumor cell surface, which mediates degradation of extracellular matrix and promotes neoangiogenesis to facilitate tumor growth. In this study, we used two glioma cell lines, mouse GL261-EGFP and rat C6/LacZ, as well as stable clones transfected with an annexin A2 knockdown construct. We find that the annexin A2 knockdown decreased glioma cell migration in vitro and decreased membrane-bound plasmin activity. In vivo, we injected the glioma cells into the rodent brain and followed glioma progression. Knockdown of annexin A2 in glioma cells decreased tumor size and slowed tumor progression, as evidenced by decreased invasion, angiogenesis, and proliferation, as well as increased apoptosis in the tumor tissue of the annexin A2 knockdown group. Moreover, we report that the levels of expression of annexin A2 in human glioma samples correlate with their degree of malignancy. Together, our findings demonstrate that inhibition of annexin A2 expression in glioma cells could become a new target for glioma therapy.


Figures

Figure 1.
Figure 1.
GL261 expresses tPA, plasminogen, and annexin A2, and knockdown of annexin A2 expression in glioma cells decreases membrane-bound tPA activity. A, Left, Annexin A2 and plasminogen expression was detected by Western blot. Annexin A2 is overexpressed in GL261 compared with microglia and astrocytes. Plasminogen is expressed by GL261 but not microglia or astrocytes. Right, Expression of annexin A2 in control CRL2541 cells and primary rat astrocytes. Thirty micrograms of protein extracts were loaded on each lane, and the exposure time was 10 min. Note that the expression in rat cells is very low. B, Zymography of GL261 lysate (10 μg) and conditioned medium (20 μl) shows that tPA is expressed and secreted by GL261. C, Immunofluorescent staining of GL261 cell membrane with tPA and annexin A2 antibodies showed colocalization of these two proteins. D, Annexin A2 expression levels for GL261–EGFP and GL261–EGFP–annA2KD clones were evaluated by Western blot and normalized to α-tubulin levels. E, An amidolytic assay was used to measure tPA activity in membrane and cytoplasmic protein fractions of GL261–EGFP clones. F, GL261–EGFP–annA2KD clones had similar proliferation rate as GL261–EGFP. The cell proliferation rate was measured by BrdU incorporation rate (n = 3).
Figure 2.
Figure 2.
C6 glioma cells express annexin A2. A, Immunofluorescence. C6 glioma cells, propagated on chamber slides, were fixed in methanol (5 min, −20°C), blocked with 0.2% BSA in PBS (10 min, 21°C), and incubated with either mouse monoclonal anti-A2 (Zymed Laboratories; 1:100, 72 h, 4°C; top panel) or non-immune isotype-matched IgG (Zymed Laboratories; 1:100, 72 h, 4°C; bottom panel). After two washes in PBS, primary antibody reactivity was detected with FITC-labeled goat anti-mouse IgG (1:250, 60 min, 21°C). B, Flow cytometric analyses. C6 cells were incubated with polyclonal pre-immune (open peak) or anti–annexin A2 IgG (solid peak) (70 μg/ml, 4°C, 60 min) followed by fluorescein isothiocyanate-conjugated goat anti-rabbit IgG (30 μg/ml, 4°C, 30 min; Cappel Laboratories), fixed in 2% paraformaldehyde (2 min, 21°C), and analyzed in a BD Biosciences flow cytometer (FACS Calibur). C6 glioma cells propagated in 24-well tissue culture plates were incubated with [125I]plasminogen (24,900 cpm/pmol) (C) or [125I]t-PA (503,000 cpm/pmol) in HBS containing 3 mm CaCl2, 1 mm MgCl2, and 5 mg/dl BSA (200 μl/well, 4°C, 60 min) over a range of concentrations (0–267 and 0–174 nm, respectively) (D). After sampling unbound ligand, cells were washed and solubilized, and bound radioactivity was counted. Scatchard analyses were performed as described previously (insets). E, Characterization of annexin A2 expression in stably transfected C6/LacZ glioma cells. Whole-cell lysates from annexin A2 sense- and antisense-transfected C6/LacZ cells were immunoblotted with monoclonal anti-annexin A2 IgG or polyclonal anti-4F2hc (21°C, 60 min) (Jacovina et al., 2001), using enhanced chemiluminescence (GE Healthcare). Annexin A2 expression was estimated after normalizing to the 4F2hc loading control using the Sigma gel scanning program (Jandel Scientific, version 1.0). F, Plasmin generation. Transfected C6/LacZ cells were incubated with plasminogen and t-PA, and plasmin generation was estimated as AFC-81 hydrolysis.
Figure 3.
Figure 3.
Knockdown of annexin A2 decreases glioma cell migration in culture. A scratch-migration assay was performed to evaluate cell migration. Representative images from each clone at 0 and 24 h are shown in A. White dashed lines indicate the edges of the scratch. B, Migrated cells between scratch edges in three random fields from each plate were enumerated (n = 3). C, The migrating cells were stained with antibodies against tPA and annexin A2 to examine their expression and colocalization. D, Directed migration. Three separate clones of annexin A2 antisense-transfected C6 cells (open bars), as well as annexin A2 sense-transfected C6 cells (filled bars) and nontransfected C6 cells (cross-hatched bars) were plated on laminin-coated porous filter inserts, incubated with plasminogen (100 nm) and t-PA (10 nm), and analyzed after 12 h as described in Materials and Methods. Shown are mean ± SE values for three separate experiments. Comparisons designated by a–d and g–j are all statistically significant at the p < 0.01 level. Comparisons e and f show no significant difference. GL261 cells (E) and resting or activated CRL2541 astrocytes (F) were labeled with rhodamine-conjugated phalloidin and stained with anti-annexin A2 to detect the morphology of actin filaments and the direction of migration. Blue, DAPI to visualize nuclei.
Figure 4.
Figure 4.
Knockdown of annexin A2 on glioma cell impairs tumor progression in vivo, but lack of annexin A2 in stromal cells has no effect on glioma growth. A, Tumor volumes were measured at 10, 15, and 20 d after tumor cell injection (n = 8, from 4 independent injections). B, Kaplan–Meier survival curves of tumor-bearing mice (p = 0.0003, n = 10). Tumor size (C) and MVD (D) were measured 15 d after tumor injection into wt and annA2KO mice (wt mice: tumor size, n = 8; MVD, n = 5; annA2 KO mice: n = 2).
Figure 5.
Figure 5.
Animals receiving annA2KD glioma display less proliferation within the tumor tissue. Proliferation of tumor tissue and cells was quantified after Ki67 (A–C) and p-histone H3 (D–F) immunofluorescent staining (n = 5).
Figure 6.
Figure 6.
Knockdown of annexin A2 in glioma cells increases glioma apoptosis. The degree of apoptosis of tumor tissue and cells was quantified after activated caspase-3 immunofluorescent staining (A–C) and TUNEL assay (D–F) (n = 5).
Figure 7.
Figure 7.
Higher-magnification pictures of immunofluorescent staining with Ki67 (A), p-histone H3 (B), and activated caspase-3 (C) antibodies as well as TUNEL assay (D) to demonstrate the cell specificity.
Figure 8.
Figure 8.
Knockdown of annexin A2 decreases glioma invasion in vivo. Tumor invasion was quantified by measuring the invasive front as a percentage of total tumor area (A, B) as well as maximal invasion distance (C) (n = 5). White dashed lines define the border between tumor mass and invasive area. D, Diffuse infiltration of glioma cells into the brain parenchyma. Arrows point to infiltrating tumor cells.
Figure 9.
Figure 9.
Knockdown of annexin A2 decreased glioma angiogenesis. A, The blood vessels were identified based on immunofluorescent staining of endothelial cells. B, MVD in glioma tissue was quantified by counting blood vessel number in twenty 20× fields. C, The blood vessel diameters were measured and used to sort MVD based on the sizes (n = 5).
Figure 10.
Figure 10.
Immunohistochemical localization of annexin in human gliomas. S (Stony Brook Cohort): A, normal cerebellum; BD, grade I astrocytoma (pilocytic astrocytoma); E, grade II astrocytoma; F, grade III astrocytoma (anaplastic astrocytoma); G–J, Grade IV astrocytoma (GBM). Quantification of annA2 expression is shown below the panels (#p = 0.01). W (Weill Cornell Medical Center cohort): A, B, Placenta control; C, D, benign pilocytic astrocytoma (patient age, 2 years; sex, male); E, F, high-grade astrocytoma (patient age, 61 years; sex, male); G–L, highly invasive glioblastoma multiforme (G, H: patient age, 80 years: sex, female; I, J: patient age, 66 years; sex, male; K, L: patient age, 74 years; sex, female). Sections were stained with monoclonal anti-annexin A2 (A, C, E, G, I, K) or non-immune IgG (NI; B, D, F, H, J, L). Scale bar, 200 μm.

Similar articles

Cited by

References

    1. Allegranza A, Girlando S, Arrigoni GL, Veronese S, Mauri FA, Gambacorta M, Pollo B, Dalla Palma P, Barbareschi M. Proliferating cell nuclear antigen expression in central nervous system neoplasms. Virchows Arch A Pathol Anat Histopathol. 1991;419:417–423. - PubMed
    1. Amberger VR, Hensel T, Ogata N, Schwab ME. Spreading and migration of human glioma and rat C6 cells on central nervous system myelin in vitro is correlated with tumor malignancy and involves a metalloproteolytic activity. Cancer Res. 1998;58:149–158. - PubMed
    1. Bao H, Jiang M, Zhu M, Sheng F, Ruan J, Ruan C. Overexpression of Annexin II affects the proliferation, apoptosis, invasion and production of proangiogenic factors in multiple myeloma. Int J Hematol. 2009;90:177–185. - PubMed
    1. Barth RF, Kaur B. Rat brain tumor models in experimental neuro-oncology: the C6, 9L, T9, RG2, F98, BT4C, RT-2 and CNS-1 gliomas. J Neurooncol. 2009;94:299–312. - PMC - PubMed
    1. Beckner ME, Chen X, An J, Day BW, Pollack IF. Proteomic characterization of harvested pseudopodia with differential gel electrophoresis and specific antibodies. Lab Invest. 2005;85:316–327. - PubMed

Publication types