. 2011 Nov 15;17(22):7003-14.
doi: 10.1158/1078-0432.CCR-11-1870. Epub 2011 Oct 5.

Novel chromosomal rearrangements and break points at the t(6;9) in salivary adenoid cystic carcinoma: association with MYB-NFIB chimeric fusion, MYB expression, and clinical outcome

Affiliations

Novel chromosomal rearrangements and break points at the t(6;9) in salivary adenoid cystic carcinoma: association with MYB-NFIB chimeric fusion, MYB expression, and clinical outcome

Yoshitsugu Mitani et al. Clin Cancer Res. .

Abstract

Objective: To investigate the molecular genetic heterogeneity associated with the t(6:9) in adenoid cystic carcinoma (ACC) and correlate the findings with patient clinical outcome.

Experimental design: Multimolecular and genetic techniques complemented with massive pair-ended sequencing and single-nucleotide polymorphism array analyses were used on tumor specimens from 30 new and 52 previously analyzed fusion transcript-negative ACCs by reverse transcriptase PCR (RT-PCR). MYB mRNA expression level was determined by quantitative RT-PCR. The results of 102 tumors (30 new and 72 previously reported cases) were correlated with the clinicopathologic factors and patients' survival.

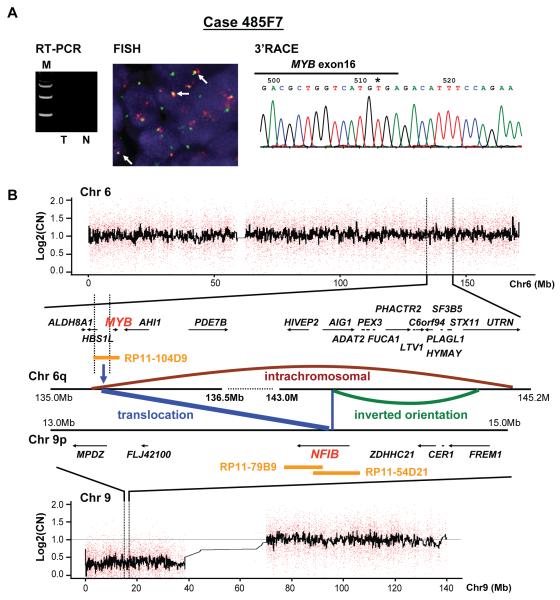
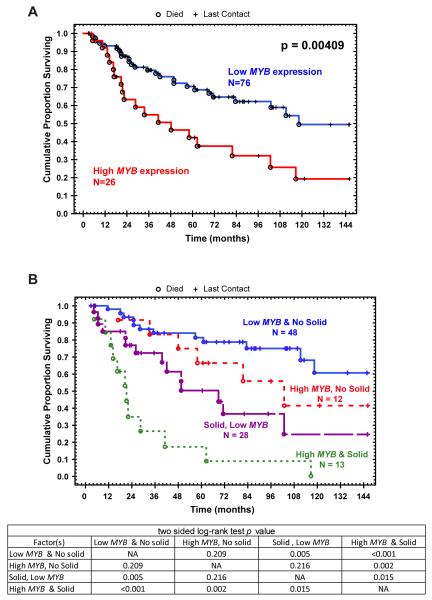
Results: The FISH analysis showed 34 of 82 (41.5%) fusion-positive tumors and molecular techniques identified fusion transcripts in 21 of the 82 (25.6%) tumors. Detailed FISH analysis of 11 out the 15 tumors with gene fusion without transcript formation showed translocation of NFIB sequences to proximal or distal sites of the MYB gene. Massive pair-end sequencing of a subset of tumors confirmed the proximal translocation to an NFIB sequence and led to the identification of a new fusion gene (NFIB-AIG1) in one of the tumors. Overall, MYB-NFIB gene fusion rate by FISH was in 52.9% whereas fusion transcript forming incidence was 38.2%. Significant statistical association between the 5' MYB transcript expression and patient survival was found.

Conclusions: We conclude that: (i) t(6;9) results in complex genetic and molecular alterations in ACC, (ii) MYB-NFIB gene fusion may not always be associated with chimeric transcript formation, (iii) noncanonical MYB-NFIB gene fusions occur in a subset of tumors, (iv) high MYB expression correlates with worse patient survival.


Figures

Figure 1
Figure 1
A) Schematic representation of the location of the MYB chromosome 6q23 and the NFIB on 9p22-23 and the BAC clones used for the FISH analysis. RP11-104D9 was used as a probe for MYB and probes RP11-79B and RP11-54D21 were used for the NFIB gene in the FISH analysis. B) Schematic structure of the MYB and the NFIB genes and the primers used for the RT-PCR and the 3′RACE analysis. The exon numbers of MYB are based on NCBI database (accession number NM_001130173). NFIB exon numbers were obtained from accession number ENSG0000147862 for NFIB in the Ensembl database; note MYB exon 10 is not included any MYB-NFIB chimeric transcripts and intact MYB. ‡MYB exon 10 is also known well as exon 9B (accession number HSU22376). C) RT-PCR analysis of MYB-NFIB fusion transcripts using new primer sets. Asterisk points to case #161B4 where gene fusion was detected by FISH without transcript formation. D) FISH analysis using BAC clones of MYB (green) and NFIB (red) genes in transcript negative gene fusion positive ACC (394D7 case). White arrows point to the yellow signal representing the MYB and NFIB gene fusion. E) Sequence illustration shows fusion of MYB exon 15 with NFIB 3′UTR, as detected by 3′RACE in 394D7 case. F) Represents the MYB transcript expression of the 30 new cases. The red bars denote the MYB-NFIB transcript positive samples, whereas the blue bars represent the expression level in fusion negative tumors. The asterisks point to tumors with MYB/NFIB gene fusion by FISH only. Results are represented as fold increase relative to MYB expression in pooled normal salivary gland tissue.
Figure 2
Figure 2
The chromosomal rearrangements in case 485F7, as an example of genomic MYB-NFIB fusion without transcript formation. A) RT-PCR analysis shows as MYB-NFIB transcript negative (T) and corresponding normal (N). The 3′RACE analysis reveals that the last exon 16 of MYB gene is intact. B) Genomic rearrangement and copy number changes of chromosomes 6 and 9 of the same tumor. The center schematic representation depicts the intra- and inter-chromosomal structures generated from the massively pared-end tag sequencing data. Blue bars, chromosomal rearrangement (MYB-NFIB and NFIB-AIG1); brown bar, intra-chromosomal rearrangement between HBS1L and UTRN gene; green bar, inverted orientation between AIG1 and UTRN gene. Blue vertical arrow indicates NFIB gene breaks at intron 7 that translocates to chromosome 6q22 just proximal to the MYB upstream. MYB probe (RP11-104D9) and NFIB probe (RP11-79B and RP11-54D21) are shown as FISH probes.
Figure 3
Figure 3
Alternative breakpoint in the proximal or the distal sites of the MYB gene. A) The schematic representation of FISH probe for MYB gene displays the overlapping of RP11-378M and RP11-55H4 probes with the initial screening probe (RP11-104D9). The arrows showed the break point locations, and the asterisk means a breakage at 99kb upstream of MYB gene in 485F7 samples. B) The white arrows point to a yellow signal representing the t(6;9) translocation. Case 78 is positive for both.
Figure 4
Figure 4
Kaplan-Meier survival curves of ACCs patients: A) correlation between high MYB exon 2-3 expression and poor patient survival (p=0.004, log-rank test). B) survival curves of MYB transcript expression, Adenoid Cystic Carcinoma with solid component and patients survival.

References

    1. Batsakis JG, Regezi JA, Luna MA, El-Naggar AK. Histogenesis of salivary gland neoplasms: a postulate with prognostic implications. J Laryngol Otol. 1989;103:939–44. - PubMed
    1. Batsakis JG, Luna MA, El-Naggar AK. Histopathologic grading of salivary gland neoplasms: III. Adenoid cystic carcinomas. Ann Otol Rhinol Laryngol. 1990;99:1007–9. - PubMed
    1. Chomette G, Auriol M, Tranbaloc P, Vaillant JM. Adenoid cystic carcinoma of minor salivary glands. Analysis of 86 cases. Clinico-pathological, histoenzymological and ultrastructural studies. Virchows Arch A Pathol Anat Histol. 1982;395:289–301. - PubMed
    1. Spiro RH. Salivary neoplasms: overview of a 35-year experience with 2,807 patients. Head Neck Surg. 1986;8:177–84. - PubMed
    1. Fordice J, Kershaw C, El-Naggar AK, Goepfert H. Adenoid cystic carcinoma of the head and neck: predictors of morbidity and mortality. Arch Otolaryngol Head Neck Surg. 1999;125:149–52. - PubMed

Publication types

MeSH terms

Substances