Review
. 2011 Oct;24(4):792-805.
doi: 10.1128/CMR.00014-11.

Immunodiagnosis of tuberculosis: a dynamic view of biomarker discovery

Affiliations
Review

Immunodiagnosis of tuberculosis: a dynamic view of biomarker discovery

Shajo Kunnath-Velayudhan et al. Clin Microbiol Rev. 2011 Oct.

Abstract

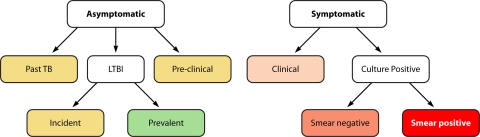
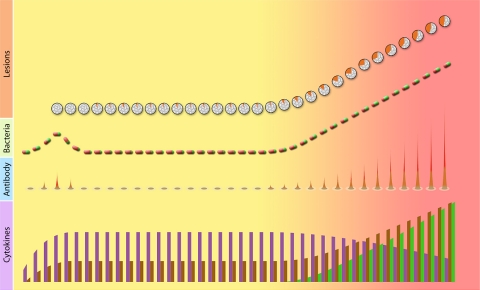
Infection with Mycobacterium tuberculosis causes a variety of clinical conditions ranging from life-long asymptomatic infection to overt disease with increasingly severe tissue damage and a heavy bacillary burden. Immune biomarkers should follow the evolution of infection and disease because the host immune response is at the core of protection against disease and tissue damage in M. tuberculosis infection. Moreover, levels of immune markers are often affected by the antigen load. We review how the clinical spectrum of M. tuberculosis infection correlates with the evolution of granulomatous lesions and how granuloma structural changes are reflected in the peripheral circulation. We also discuss how antigen-specific, peripheral immune responses change during infection and how these changes are associated with the physiology of the tubercle bacillus. We propose that a dynamic approach to immune biomarker research should overcome the challenges of identifying those asymptomatic and symptomatic stages of infection that require antituberculosis treatment. Implementation of such a view requires longitudinal studies and a systems immunology approach leading to multianalyte assays.


Figures

Fig. 1.
Fig. 1.
Clinical states of M. tuberculosis infection. This schematic is adapted from the classification of TB by the American Thoracic Society (ATS) (2). ATS class numbers are also indicated, as applicable. Infected individuals are divided into asymptomatic and symptomatic. (i) The asymptomatic group is further divided into subgroups; color codes indicate the relative risk of progression to active disease in each subgroup (green, low; yellow, high). Past TB (inactive TB; class 4) indicates either a history of a previous episode(s) of active TB or abnormal stable radiographic findings and no bacteriological and/or radiographic evidence of current disease. LTBI (class 1) indicates a positive TST/IGRA and no clinical, bacteriological, or radiographic evidence of active disease. LTBI is further divided into incident/recent (<2 years after infection) or prevalent/remote (>2 years postinfection). The preclinical TB/incipient TB group includes asymptomatic individuals found to have developed active disease when examined at later (short-term) times. (ii) The symptomatic group is also further divided into subgroups; here, color codes indicate bacillary load (orange, low; red, high). Clinical TB indicates symptoms and/or radiographic findings suggestive of active TB but no bacteriological evidence of disease. Culture-confirmed TB (class 3) indicates bacteriological evidence of active TB. These patients are further subdivided into smear-negative and smear-positive groups based on sputum smear microscopy (It is noted that the extent of radiographic lung involvement, such as cavitary and noncavitary disease, is often also used to classify patients.).
Fig. 2.
Fig. 2.
Schematic representation of bacteriological, histopathological, and immunological changes during M. tuberculosis infection. The background color reflects the clinical spectrum of infection, progressing from asymptomatic (yellow) to symptomatic (red). The changes in the granulomatous lesions are shown relative to the number of lesions (vertical axis) and the quality of the granuloma (color composition). In each granuloma icon, the gray, granular area represents cells, while the solid orange color represents caseum. For tubercle bacilli, bacterial numbers (vertical axis) and phenotype (color composition of the bacilli) are depicted. In each icon, the color indicates the growth phase (green, growing bacilli; red, nongrowing bacilli). For antibody levels, the icon, which represents antibody responses to the entire proteome, is roughly divided into a nonreactive, dominant area of the proteome (outer, colorless) an and inner, reactive area (red gradient). The gradient of red indicates rarely reactive (orange) and commonly reactive (dark red) proteins. The height of the reactive proteome area (vertical axis) represents the frequency of reactive TB sera. The early, transient peak shown in the antibody curve is derived from monkey and human data. A similar course of the bacillary curve is inferred from the likelihood that tubercle bacilli multiply before immunity is expressed and bacillary growth is controlled. For cytokine levels, three hypothetical patterns are shown, with levels (vertical axis) decreasing (purple) or increasing (brown) with disease progression or being detected only during active disease (green). Each pattern may be characteristic of one or more cytokines.

References

    1. Abebe F., Holm-Hansen C., Wiker H. G., Bjune G. 2007. Progress in serodiagnosis of Mycobacterium tuberculosis infection. Scand. J. Immunol. 66:176–191 - PubMed
    1. American Thoracic Society 2000. Diagnostic standards and classification of tuberculosis in adults and children. Am. J. Respir. Crit. Care Med. 161:1376–1395 - PubMed
    1. American Thoracic Society 2000. Targeted tuberculin testing and treatment of latent tuberculosis infection. MMWR Recommend. Rep. 49:1–51 - PubMed
    1. Andersen P., Askgaard D., Ljungqvist L., Bennedsen J., Heron I. 1991. Proteins released from Mycobacterium tuberculosis during growth. Infect. Immun. 59:1905–1910 - PMC - PubMed
    1. Andersen P., Doherty T. M., Pai M., Weldingh K. 2007. The prognosis of latent tuberculosis: can disease be predicted? Trends Mol. Med. 13:175–182 - PubMed

Publication types

MeSH terms