. 2011 Dec 2;286(48):41135-41152.
doi: 10.1074/jbc.M111.302596. Epub 2011 Oct 5.

Efnb1 and Efnb2 proteins regulate thymocyte development, peripheral T cell differentiation, and antiviral immune responses and are essential for interleukin-6 (IL-6) signaling

Affiliations

Efnb1 and Efnb2 proteins regulate thymocyte development, peripheral T cell differentiation, and antiviral immune responses and are essential for interleukin-6 (IL-6) signaling

Hongyu Luo et al. J Biol Chem. .

Abstract

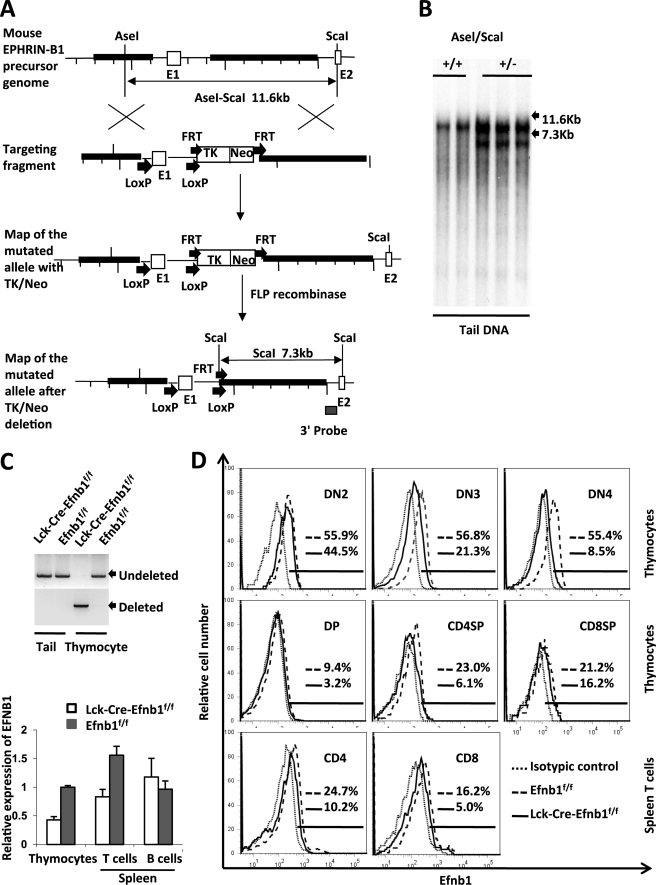
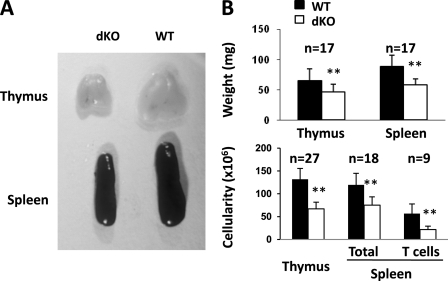
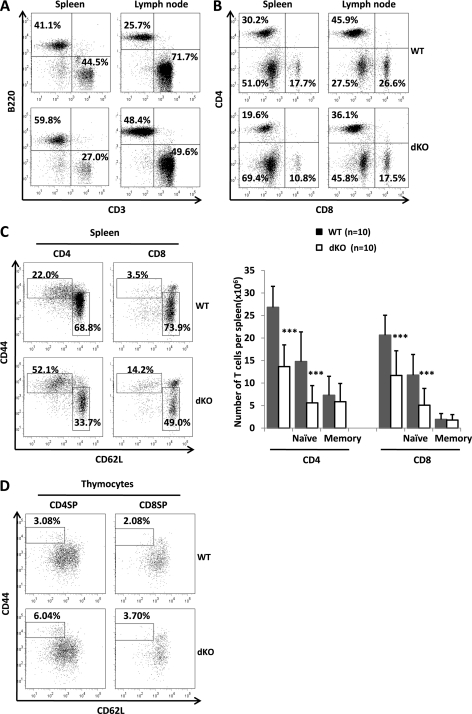
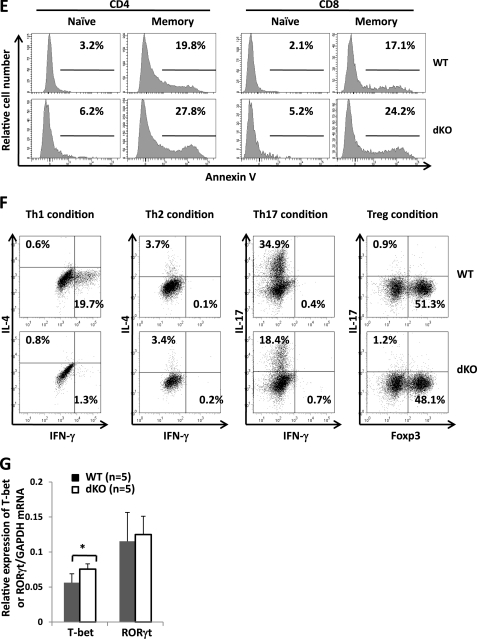
Erythropoietin-producing hepatocellular kinases (Eph kinases) constitute the largest family of cell membrane receptor tyrosine kinases, and their ligand ephrins are also cell surface molecules. Because of promiscuous interaction between Ephs and ephrins, there is considerable redundancy in this system, reflecting the essential roles of these molecules in the biological system through evolution. In this study, both Efnb1 and Efnb2 were null-mutated in the T cell compartment of mice through loxP-mediated gene deletion. Mice with this double conditional mutation (double KO mice) showed reduced thymus and spleen size and cellularity. There was a significant decrease in the DN4, double positive, and single positive thymocyte subpopulations and mature CD4 and CD8 cells in the periphery. dKO thymocytes and peripheral T cells failed to compete with their WT counterparts in irradiated recipients, and the T cells showed compromised ability of homeostatic expansion. dKO naive T cells were inferior in differentiating into Th1 and Th17 effectors in vitro. The dKO mice showed diminished immune response against LCMV infection. Mechanistic studies revealed that IL-6 signaling in dKO T cells was compromised, in terms of abated induction of STAT3 phosphorylation upon IL-6 stimulation. This defect likely contributed to the observed in vitro and in vivo phenotype in dKO mice. This study revealed novel roles of Efnb1 and Efnb2 in T cell development and function.


Figures

FIGURE 1.
FIGURE 1.
Generation of mice with T cell-specific Efnb1f/f and Efnb2f/f null mutation. A and E, schemes of Efnb1f/f and Efnb2f/f mouse generation. The schemes of genetic manipulation to generate floxed Efnb1 (A) and Efnb2 (E) mice are illustrated. Bold lines represent left and right arms of genomic sequences used in gene targeting. Empty squares represent exons (E) or thymidine kinase gene/neomycin-resistant gene cassettes (TK/Neo). LoxP and FRT sites are represented by large and small arrowheads, respectively. The solid box represents a genomic region from which probes were produced for Southern blot analysis. B and F, Southern blot analysis of tail DNA of Efnb1- and Efnb2-targeted mice. For Efnb1-targeted mice (B), tail DNA was digested with AseI and ScaI and analyzed by Southern blotting. The 11.6-kb band was derived from the wild type allele, and the 7.3-kb band was from the mutated allele. For Efnb2-targeted mice (F), the tail DNA was digested with PacI and analyzed by Southern blotting. The 15.5-kb band was derived from the wild type allele, and the 8.1-kb band was from the mutated allele. C and G, T cell-specific deletion of Efnb1 and Efnb2 in Lck-Cre-Efnb1f/f and Lck-Cre-Efnb2f/f mice according to PCR. Efnb1f/f mice and Efnb2f/f mice were crossed with transgenic mice harboring Cre recombinase driven by the proximal LCK promoter. In the upper panel, the tail and thymocyte DNA of the mice was analyzed with PCR using primer pairs 1 and 2 as described in supplemental material. For Efnb1f/f mice, primer pair 1 detected a 271-bp fragment derived from the undeleted allele, although primer pair 2 detected a 492-bp fragment derived from the allele with Efnb1 exon 1 deleted. For Efnb2f/f mice, primer pair 1 detected a 459-bp fragment derived from the undeleted allele, whereas primer pair 2 detected a 291-bp fragment derived from the allele with the Efnb2 exon 1 deleted. In the lower panel, total RNA was extracted from Lck-Cre-Efnb1f/f (C) or Lck-Cre-Efnb2f/f (G) thymocytes, spleen T cells, and spleen B cells. Their Efnb1 and Efnb2 mRNA was analyzed by RT/qPCR using β-actin as an internal control. Data are expressed as the means ± S.D. of the ratios of Efnb1/β-actin (C) and Efnb2/β-actin (G) signals. D and H, deletion of Efnb1 and Efnb2 expression in Lck-Cre-Efnb1f/f and Lck-Cre-Efnb2f/f thymocytes and spleen T cells according to flow cytometry. Thymocytes at different differentiation stages (DN2–4, DP, CD4SP, and CD8SP) and spleen CD4 and CD8 cells were gated and were analyzed for Efnb1 expression (E) or Efnb2 expression (H) by flow cytometry. The dotted line, isotypic control Ab; the dashed line, control WT cells stained with anti-Efnb1 or anti-Efnb2 Abs; the solid line, Lck-Cre-Efnb1f/f and Lck-Cre-Efnb2f/f cells stained with anti-Efnb1 or anti-Efnb2 Abs, respectively. The percentage of Efnb1- or Efnb2-positive cells after the deduction of the background signal (isotypic Ab control) is shown. All the experiments in this figure were repeated two or more times, and data from representative ones are shown.
FIGURE 1.
FIGURE 1.
Generation of mice with T cell-specific Efnb1f/f and Efnb2f/f null mutation. A and E, schemes of Efnb1f/f and Efnb2f/f mouse generation. The schemes of genetic manipulation to generate floxed Efnb1 (A) and Efnb2 (E) mice are illustrated. Bold lines represent left and right arms of genomic sequences used in gene targeting. Empty squares represent exons (E) or thymidine kinase gene/neomycin-resistant gene cassettes (TK/Neo). LoxP and FRT sites are represented by large and small arrowheads, respectively. The solid box represents a genomic region from which probes were produced for Southern blot analysis. B and F, Southern blot analysis of tail DNA of Efnb1- and Efnb2-targeted mice. For Efnb1-targeted mice (B), tail DNA was digested with AseI and ScaI and analyzed by Southern blotting. The 11.6-kb band was derived from the wild type allele, and the 7.3-kb band was from the mutated allele. For Efnb2-targeted mice (F), the tail DNA was digested with PacI and analyzed by Southern blotting. The 15.5-kb band was derived from the wild type allele, and the 8.1-kb band was from the mutated allele. C and G, T cell-specific deletion of Efnb1 and Efnb2 in Lck-Cre-Efnb1f/f and Lck-Cre-Efnb2f/f mice according to PCR. Efnb1f/f mice and Efnb2f/f mice were crossed with transgenic mice harboring Cre recombinase driven by the proximal LCK promoter. In the upper panel, the tail and thymocyte DNA of the mice was analyzed with PCR using primer pairs 1 and 2 as described in supplemental material. For Efnb1f/f mice, primer pair 1 detected a 271-bp fragment derived from the undeleted allele, although primer pair 2 detected a 492-bp fragment derived from the allele with Efnb1 exon 1 deleted. For Efnb2f/f mice, primer pair 1 detected a 459-bp fragment derived from the undeleted allele, whereas primer pair 2 detected a 291-bp fragment derived from the allele with the Efnb2 exon 1 deleted. In the lower panel, total RNA was extracted from Lck-Cre-Efnb1f/f (C) or Lck-Cre-Efnb2f/f (G) thymocytes, spleen T cells, and spleen B cells. Their Efnb1 and Efnb2 mRNA was analyzed by RT/qPCR using β-actin as an internal control. Data are expressed as the means ± S.D. of the ratios of Efnb1/β-actin (C) and Efnb2/β-actin (G) signals. D and H, deletion of Efnb1 and Efnb2 expression in Lck-Cre-Efnb1f/f and Lck-Cre-Efnb2f/f thymocytes and spleen T cells according to flow cytometry. Thymocytes at different differentiation stages (DN2–4, DP, CD4SP, and CD8SP) and spleen CD4 and CD8 cells were gated and were analyzed for Efnb1 expression (E) or Efnb2 expression (H) by flow cytometry. The dotted line, isotypic control Ab; the dashed line, control WT cells stained with anti-Efnb1 or anti-Efnb2 Abs; the solid line, Lck-Cre-Efnb1f/f and Lck-Cre-Efnb2f/f cells stained with anti-Efnb1 or anti-Efnb2 Abs, respectively. The percentage of Efnb1- or Efnb2-positive cells after the deduction of the background signal (isotypic Ab control) is shown. All the experiments in this figure were repeated two or more times, and data from representative ones are shown.
FIGURE 2.
FIGURE 2.
General features of dKO lymphoid organs. A, gross morphology of the dKO thymus and spleen. B, weight and cellularity of dKO thymus and spleen. Mouse number (n) of each group is shown. Asterisks indicate a highly significant difference (p < 0.01, paired Student's t test).
FIGURE 3.
FIGURE 3.
Flow cytometry analysis of dKO thymocytes. A, DN, DP, CD4SP, and CD8SP subpopulations in dKO thymi. Thymocytes were analyzed for DN, DP, CD4SP, and CD8SP subpopulations. Representative histograms are shown, and the percentage of each subpopulation is indicated. Data from 20 to 27 pairs of dKO and control WT mice are summarized in Table 1. B, DN2, DN3, and DN4 subpopulations in dKO thymi. Thymocytes were first gated on Lin cells, and the Lin cells were analyzed for DN2, DN3, and DN4 subpopulation based on CD25 and CD44 expression. Representative histograms are shown. Data from 20 to 27 pairs of dKO and control WT mice are summarized in Table 2. C, DN3, DN4, DP, CD4SP, and CD8SP cell proliferation in dKO thymi according to BrdU staining. Control Efnb1f/f/Efnb2f/f and dKO mice were injected intraperitoneally with BrdU (1 mg/mouse), and their thymocytes were analyzed by flow cytometry 90 min later. Thymocytes were stained with lineage markers as well as anti-BrdU Ab. Percentages of BrdU-positive DN3 (CD25+icTCRβ and CD25+icTCRβ+), DN4 (CD25icTCRβ+), DP, CD4SP, and CD8SP cells are shown. D, dKO thymocyte apoptosis. dKO and WT control thymocytes were stained with annexin V and lineage markers ex vivo or cultured for 24 h in plain medium and then analyzed as indicated. The percentage of annexin V-positive cells in DN3, DN4, DP, CD4SP, and CD8SP cells is shown. In C and D, the experiments were repeated more than three times, and representative histograms are shown.
FIGURE 4.
FIGURE 4.
Flow cytometry analysis of dKO peripheral lymphocytes and their in vitro differentiation. A, T and B cell subpopulations in dKO spleens. Spleen and lymph node cells were stained with anti-CD3 and anti-B220 Abs for T and B cells, respectively. Percentage of CD3- and B220-positive cells is shown. B, CD4 and CD8 T cell subpopulations in dKO spleens. Spleen or lymph node cells were stained with anti-CD4 and anti-CD8 Abs for CD4 and CD8 T cells, respectively. Percentage of CD4- and CD8-positive cells is shown. C, naive and memory T cell populations in dKO spleens. CD44loCD62Lhi cells and CD44hiCD62Llo cells among CD4+ and CD8+ spleen cells were analyzed, and their percentage is shown in the histogram. The bar graph at left illustrates the absolute number of CD44loCD62Lhi cells and CD44hiCD62Llo cells in the spleen based on the calculation of the percentage and spleen cellularity of 10 pairs of dKO and WT mice. ***, p < 0.001 (Student's t tests). D, CD44loCD62Lhi cells and CD44hiCD62Llo cells in the dKO SP thymocytes. CD4SP and CD8SP thymocytes were gated, and CD44hiCD62Llo cells among these subpopulations were analyzed by flow cytometry. Their percentage is shown in the histograms. E, apoptosis of spleen CD44loCD62Lhi cells and CD44hiCD62Llo T cells of dKO mice. dKO and WT spleen CD44loCD62Lhi cells and CD44hiCD62Llo cells in the CD4 and CD8 subpopulations were analyzed ex vivo for their annexin V expression by flow cytometry. F, in vitro Th1, Th2, Th17, and Treg differentiation according to intracellular IFN-γ, IL-4, IL-17, and Foxp3 staining. Naive CD4 cells were cultured under Th1, Th2, Th17, or Treg conditions (3 days for Th1, Th17, and Treg and 5 days for Th2). Cells were further stimulated with phorbol 12-myristate 13-acetate and ionomycin for 4 h before being harvested. The intracellular expression of IFN-γ, IL-4, IL-17, and Foxp3 was determined by flow cytometry. Percentage of IFN-γ, IL-4, IL-17, and Foxp3-positive cells is shown. G, expression of T-bet and RORγt mRNA in Th1 and Th17 cells. T-bet and RORγt mRNA from in vitro differentiated Th1 and Th17 cells, as described in F, was quantified by RT-qPCR, using GAPDH as an internal control. Data from five independent experiments are expressed as the means ± S.D. of the ratios of T-bet/GAPDH or RORγt/GAPDH signals. *, p < 0.05 (Student's t test). Experiments in this figure were repeated more than three times, unless indicated otherwise, and representative data are shown.
FIGURE 4.
FIGURE 4.
Flow cytometry analysis of dKO peripheral lymphocytes and their in vitro differentiation. A, T and B cell subpopulations in dKO spleens. Spleen and lymph node cells were stained with anti-CD3 and anti-B220 Abs for T and B cells, respectively. Percentage of CD3- and B220-positive cells is shown. B, CD4 and CD8 T cell subpopulations in dKO spleens. Spleen or lymph node cells were stained with anti-CD4 and anti-CD8 Abs for CD4 and CD8 T cells, respectively. Percentage of CD4- and CD8-positive cells is shown. C, naive and memory T cell populations in dKO spleens. CD44loCD62Lhi cells and CD44hiCD62Llo cells among CD4+ and CD8+ spleen cells were analyzed, and their percentage is shown in the histogram. The bar graph at left illustrates the absolute number of CD44loCD62Lhi cells and CD44hiCD62Llo cells in the spleen based on the calculation of the percentage and spleen cellularity of 10 pairs of dKO and WT mice. ***, p < 0.001 (Student's t tests). D, CD44loCD62Lhi cells and CD44hiCD62Llo cells in the dKO SP thymocytes. CD4SP and CD8SP thymocytes were gated, and CD44hiCD62Llo cells among these subpopulations were analyzed by flow cytometry. Their percentage is shown in the histograms. E, apoptosis of spleen CD44loCD62Lhi cells and CD44hiCD62Llo T cells of dKO mice. dKO and WT spleen CD44loCD62Lhi cells and CD44hiCD62Llo cells in the CD4 and CD8 subpopulations were analyzed ex vivo for their annexin V expression by flow cytometry. F, in vitro Th1, Th2, Th17, and Treg differentiation according to intracellular IFN-γ, IL-4, IL-17, and Foxp3 staining. Naive CD4 cells were cultured under Th1, Th2, Th17, or Treg conditions (3 days for Th1, Th17, and Treg and 5 days for Th2). Cells were further stimulated with phorbol 12-myristate 13-acetate and ionomycin for 4 h before being harvested. The intracellular expression of IFN-γ, IL-4, IL-17, and Foxp3 was determined by flow cytometry. Percentage of IFN-γ, IL-4, IL-17, and Foxp3-positive cells is shown. G, expression of T-bet and RORγt mRNA in Th1 and Th17 cells. T-bet and RORγt mRNA from in vitro differentiated Th1 and Th17 cells, as described in F, was quantified by RT-qPCR, using GAPDH as an internal control. Data from five independent experiments are expressed as the means ± S.D. of the ratios of T-bet/GAPDH or RORγt/GAPDH signals. *, p < 0.05 (Student's t test). Experiments in this figure were repeated more than three times, unless indicated otherwise, and representative data are shown.
FIGURE 5.
FIGURE 5.
Compromised development and expansion of dKO bone marrow cells and mature T cells in irradiated recipients. A, dKO bone marrow cells failed to compete with WT bone marrow cells in irradiated recipients. T cell-depleted dKO and WT bone marrow cells (CD45.2+) were mixed with T cell-depleted bone marrow cells from B6.SJL competitors (CD45.1+) at 1:1 ratio and transplanted to lethally irradiated C57BL/6×B6.SJL F1 recipients. After 90 days, cells from the thymus, spleen, lymph node, and blood were analyzed for CD45.2 and CD45.1 staining. Percentages of CD45.2+ cells (derived from dKO and WT control bone marrow cells), CD45.1+ cells (derived from competing B6.SJL bone marrow cells), and CD45.1+/CD45.2+ cells (derived from residual cells of the recipients) are shown. B, dKO bone marrow cells in the presence of competing B6.SJL bone marrow cells had significantly reduced capability to develop into T cells in the periphery. In the whole body irradiation-BMTx model described in A, B220+ B cells and CD3+ T cells among CD45.2+ cells (derived from dKO or control WT bone marrow cells) in the spleen, lymph node, and blood were determined by flow cytometry 90 days later; percentages are shown. C, dKO T cells presented failed homeostatic expansion in sublethally irradiated recipients. B6.SJL mice (CD45.1+) were sublethally irradiated at 600 rads and transplanted i.v. with 4 × 10⁶ CFSE-labeled spleen cells from dKO or WT control mice (CD45.2+). The histograms show profiles of carboxyfluorescein succinimidyl ester (CFSE)-positive cells gated on CD4+CD45.2+ and CD8+CD45.2+ cells. Experiments in this figure were repeated more than three times, and representative histograms are shown.
FIGURE 6.
FIGURE 6.
Compromised in vivo anti-LCMV immune responses of dKO mice. A, spleen cell number on day 8 following LCMV infection. Means ± S.D. of absolute cell number of total splenocytes, CD4+ cells, and CD8+ cells of control WT control (n = 4) and dKO (n = 4) mice on day 8 post-LCMV infection are shown. B and C, virus-specific CD8 cells on day 8 post-LCMV infection. On day 8 post-infection, the percentage of gp33, np396, and gp276 tetramer-positive cells among CD8 cells (B) and the absolute number of gp33, np396, and gp276 tetramer-positive CD8 cells per spleen were measured by flow cytometry. Means ± S.D. of data from four pairs of WT control and dKO mice are shown. D, virus-specific lymphokine-producing CD4 and CD8 cells on day 8 and day 32 post-LCMV infection. Percentage of IFN-γ-producing virus-specific CD4 cells (gp61-positive) and CD8 cells (gp33-positive) (left column), and percentage of TNF-α-producing virus-specific CD4 cells (gp61-positive) and CD8 cells (gp33-positive) (right column) were measured by flow cytometry on day 8 (upper row) and day 32 (lower row) post-LCVM infection. Means ± S.D. of data from 4 to 6 pairs of WT control and dKO mice are shown. E, cytotoxic T lymphocyte activity on day 8 post-LCMV infection. On day 8 post LCMV infection, virus-specific cytotoxic T lymphocyte activity was measured with 51Cr-release assays at different effectors versus target cell ratios. Percentage of specific lysis was calculated based on ratios of spleen cells versus target cells. Means ± S.D. of data from WT control (n = 4) and dKO (n = 3) mice are shown. A–E, data from 3 to 4 mice were pooled and analyzed by one-way analysis of variance followed by Bonferroni's multiple comparison test. p values are indicated when they reached ≤0.05.
FIGURE 7.
FIGURE 7.
Compromised IL-6 signaling in dKO T cells. A, compromised STAT3 phosphorylation upon IL-6 stimulation in dKO thymocytes and T cells. dKO and WT control thymocytes (left panel) and spleen T cells (right panel) were stimulated with IL-6 (50 ng/ml) for 5 min, and total and phosphorylated STAT3 (p-STAT3) in the cells were analyzed by immunoblotting. Immunoblotting images from representative experiments are shown. The bar graph at right illustrates the ratios of p-STAT3 versus total STAT3 signals in spleen T cells according to densitometry based on results of a total of four independent experiments. The statistically significant difference is indicated (Student's t tests). B, compromised STAT3 phosphorylation upon IL-6 stimulation in naive and memory type spleen T cells from dKO mice. Spleen T cells were stimulated with IL-6 (50 ng/ml) from 5 min, and phosphorylated STAT3 in the cells gated on CD4, CD8, naive (CD44loCD62Lhi), and memory (CD44hiCD62Llo) T cells was analyzed by intracellular staining followed by flow cytometry. The mean intensity of fluorescence intensity (MIF) of each population was indicated. The experiments in A and B were repeated twice, and representative histograms are shown.

References

    1. Eph Nomenclature Committee (1997) Cell 90, 403–404 - PubMed
    1. Wilkinson D. G. (2000) Int. Rev. Cytol. 196, 177–244 - PubMed
    1. Flanagan J. G., Vanderhaeghen P. (1998) Annu. Rev. Neurosci. 21, 309–345 - PubMed
    1. Wang H. U., Chen Z. F., Anderson D. J. (1998) Cell 93, 741–753 - PubMed
    1. Noren N. K., Pasquale E. B. (2007) Cancer Res. 67, 3994–3997 - PubMed

Publication types

MeSH terms