

Cellular pharmacokinetic and pharmacodynamic analyses of ethacrynic acid: Implications in topical drug delivery in the eye
- PMID: 21976961
- PMCID: PMC3185019
Cellular pharmacokinetic and pharmacodynamic analyses of ethacrynic acid: Implications in topical drug delivery in the eye
Abstract
Purpose: Ethacrynic acid (ECA) is a potential trabecular meshwork (TM) drug that has shown promising results in preclinical studies for treatment of primary open-angle glaucoma. However, topical application of ECA is currently limited by adverse effects in corneal tissues. To this end, we developed a new theoretical model to evaluate time-dependent toxicity induced by ECA in corneal epithelial cells.
Methods: The model consisted of a cellular pharmacokinetic (PK) module to determine intracellular concentration of ECA, and a pharmacodynamic (PD) module to determine the cytotoxicity of ECA. It was assumed that ECA-induced cytotoxicity depended on drug exposure time and peak concentration of bound ECA in cells. In addition to the model development, we experimentally determined the intracellular concentration of ECA as a function of drug dose and treatment time.
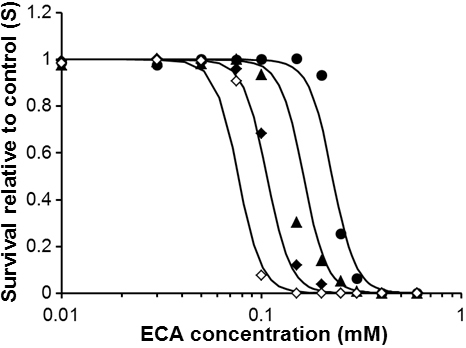
Results: The intracellular concentration increased linearly (i.e., no saturation) with increasing the dose of ECA. It also increased initially with time and then reached a steady-state at ~40 min. The percent of cells survived after treatment decreased with increasing the dose of drug or the time of treatment. The experimental data were fit by the new PK and PD models to obtain values of model constants. One of the unique applications of these models was to predict cell survival relative to control when extracellular concentration of ECA varied with time. The prediction showed that the toxicity of ECA might be significantly overestimated by using the traditional LC(50) determined in vitro.
Conclusions: The new PK and PD models developed in this study were capable to fit experimental data and predict time-dependent toxicity of ECA in corneal epithelial cells. The models may be useful for optimizing the dose and schedule in topical application of ECA for glaucoma treatment.
Figures


References
-
- Epstein DL, Freddo TF, Bassett-Chu S, Chung M, Karageuzian L. Influence of ethacrynic acid on outflow facility in the monkey and calf eye. Invest Ophthalmol Vis Sci. 1987;28:2067–75. - PubMed
-
- Epstein DL, Hooshmand LB, Epstein MP. Thiol adducts of ethacrynic acid increase outflow facility in enucleated calf eyes. Curr Eye Res. 1992;11:253–8. - PubMed
-
- Epstein DL, Roberts BC, Skinner LL. Nonsulfhydryl-reactive phenoxyacetic acids increase aqueous humor outflow facility. Invest Ophthalmol Vis Sci. 1997;38:1526–34. - PubMed
-
- Shimazaki A, Ichikawa M, Rao PV, Kirihara T, Konomi K, Epstein DL, Hara H. Effects of the new ethacrynic acid derivative SA9000 on intraocular pressure in cats and monkeys. Biol Pharm Bull. 2004;27:1019–24. - PubMed
-
- Shimazaki A, Suhara H, Ichikawa M, Matsugi T, Konomi K, Takagi Y, Hara H, Rao PV, Epstein DL. New ethacrynic acid derivatives as potent cytoskeletal modulators in trabecular meshwork cells. Biol Pharm Bull. 2004;27:846–50. - PubMed
MeSH terms
Substances
Grants and funding
LinkOut - more resources
Full Text Sources