. 2011:2011:232037.
doi: 10.1155/2011/232037. Epub 2011 Sep 29.

Antimyeloma Effects of the Heat Shock Protein 70 Molecular Chaperone Inhibitor MAL3-101

Affiliations

Antimyeloma Effects of the Heat Shock Protein 70 Molecular Chaperone Inhibitor MAL3-101

Marc J Braunstein et al. J Oncol. 2011.

Abstract

Multiple myeloma (MM) is the second most common hematologic malignancy and remains incurable, primarily due to the treatment-refractory/resistant nature of the disease. A rational approach to this compelling challenge is to develop new drugs that act synergistically with existing effective agents. This approach will reduce drug concentrations, avoid treatment resistance, and also improve treatment effectiveness by targeting new and nonredundant pathways in MM. Toward this goal, we examined the antimyeloma effects of MAL3-101, a member of a new class of non-ATP-site inhibitors of the heat shock protein (Hsp) 70 molecular chaperone. We discovered that MAL3-101 exhibited antimyeloma effects on MM cell lines in vitro and in vivo in a xenograft plasmacytoma model, as well as on primary tumor cells and bone marrow endothelial cells from myeloma patients. In combination with a proteasome inhibitor, MAL3-101 significantly potentiated the in vitro and in vivo antimyeloma effects. These data support a preclinical rationale for small molecule inhibition of Hsp70 function, either alone or in combination with other agents, as an effective therapeutic strategy for MM.


Figures
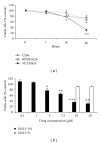
Figure 1
Figure 1
MAL3-101 induces a graded cytotoxic effect in multiple myeloma (MM) cell lines. (a) MM cell lines (1 × 10⁵) were exposed to 10 μM MAL3-101 for the indicated culture periods, and the fold change in percent viable cells in treated versus control cells was determined by an MTS assay. (b) NCI-H929 cells were exposed to the indicated concentrations of MAL3-101 or MAL3-51 for 40 h, and the percent viability, as compared to control, DMSO-treated cells, was assessed by an MTS assay. Data are presented as means and SDs from three independent experiments; *P < 0.05, **P < 0.01, and ***P < 0.001.
Figure 2
Figure 2
MAL3-101 induces cell cycle arrest and caspase-mediated apoptosis in the multiple myeloma (MM) cell line NCI-H929. (a) MM cell lines were exposed to 10 μM of MAL3-101 for 40 h, and the fold change in apoptosis in MAL3-101-treated versus control, DMSO-treated cells was determined by flow cytometry. Data are presented as means and SDs from three independent experiments; *P < 0.05. (b) The percentages of NCI-H929 cells in the G 0/G 1 and G 2/M phases of the cell cycle are indicated in each panel. This result is representative of three independent experiments that yielded similar results. (c) NCI-H929 cells were exposed to 10 μM MAL3-101 for the indicated culture periods and immunoblotted with primary antibodies to detect caspase-3 and poly(ADP-ribose) polymerase (PARP). To ensure equal loading, β-actin levels were examined as a control. Bands corresponding to intact and cleaved caspase-3 and PARP are indicated. The data are representative of four experiments.
Figure 3
Figure 3
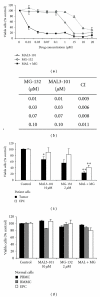
MAL3-101 and MG-132 exhibit synergistic, cytotoxic effects on multiple myeloma tumor cells and endothelial progenitor cells. (a) NCI-H929 cells (1 × 10⁵) were exposed to the indicated concentrations of MAL3-101, MG-132, or a combination of these agents for 40 h, and survival was assessed by an MTS assay; representative data from one of seven independent experiments are shown; error bars represent SDs from replicate data points. Apparent absence of error bars indicates minimal variance. (b) The fraction of nonviable cells compared to control, DMSO-treated cells in this experiment was used for isobologram analysis. In brief, the cellular fraction affected (Fa) was calculated based on the indicated MTS assays using the following formula: Fa = 100 minus the percent of viable cells. Fa values at the indicated drug concentrations were used by CalcuSyn to derive combination index (CI) values, where CI = 1 indicates additive effects, CI < 1 indicates synergy, and CI > 1 indicates antagonism [14]. (c) Bone-marrow-derived tumor cells (black bars) and confluent endothelial progenitor cells (EPCs) (white bars) from multiple myeloma patients were exposed to the indicated concentrations of MAL3-101, MG-132, or their combination, and survival was assessed by an MTS assay. Dunnett's test, after significant one-way repeated-measures analyses of variance (P = 0.004 and 0.002 for tumor cells and EPCs, resp.), compared control values to cell viability in cultures treated with MAL3-101, MG-132, or MAL3-101 + MG-132 (*P ≤ 0.05, **P ≤ 0.001). (d) Normal peripheral blood mononuclear cells (PBMCs, black bars), bone marrow mononuclear cells (BMMCs, gray bars), and confluent bone-marrow-derived EPCs (white bars) were exposed to the indicated concentrations of MAL3-101, MG-132, or a combination of these agents, and survival was assessed by an MTS assay.
Figure 4
Figure 4
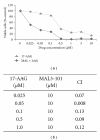
MAL3-101 and 17-AAG exhibit synergistic, cytotoxic effects on the MM cell line NCI-H929. (a) NCI-H929 cells (1 × 10⁵) were exposed to 17-AAG alone or in combination with 10 μM of MAL3-101 for 40 h, and survival was assessed by an MTS assay. Representative data from one of three experiments are shown; error bars represent SDs from replicate data points. An apparent absence of error bars indicates minimal variance. (b) The fraction of nonviable cells compared to control, DMSO-treated cells in this experiment was used for isobologram analysis in CalcuSyn to derive combination index (CI) values, where CI < 1 indicates synergy [14].
Figure 5
Figure 5
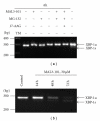
The unfolded protein response is not induced in NCI-H929 cells in response to chaperone and/or proteasome inhibition. RT-PCR analysis was performed to assess XBP-1 mRNA splicing in NCI-H929 cells, and arrows on the right indicate the 285 bp unspliced (XPB-1u) and the 259 bp spliced (XPB-1s) mRNA. (a) NCI-H929 cells were exposed for 4 h to MAL3-101, MG-132, 17AAG, or the indicated combination of the compounds, and total RNA was extracted for RT-PCR amplification. NCI-H929 cells treated for 4 h with 5 μg/mL tunicamycin (TM) as a positive control induced XBP-1 mRNA splicing. (b) NCI-H929 cells were exposed for 0, 24, 48, and 72 h to 30 μM MAL3-101, and total mRNA was extracted for RT-PCR amplification.
Figure 6
Figure 6
Effect of MAL3-101 and PS-341 on myeloma cell growth in vivo. (A) shows repeated measures as condition effect in NSG mice which were inoculated subcutaneously in the right flank with 3 × 10⁷ NCI-H929 cells. Mice received 40 mg/kg MAL3-101, 1 mg/kg PS-341, a combination of these agents, or the vehicle twice weekly i.p. (n = 16). Tumor volume assessments were performed on indicated days. Overall repeated measures by treatment condition were observed (F(15,50) = 4.89; P = 0.00001), and MAL3-101 and PS-341 each delayed tumor growth over 20 days from initial treatment; however, in combination, MAL3­101 and PS-341 had a greater effect than the single treatments by delaying tumor progression and reducing tumor size. Vertical bars denote 0.95 confidence interval. a–e refer to results of ANOVAs for effect of treatment by day on tumor inhibition. (a) Overall condition effect on day 6: F(3,10) = 5.40; P = 0.018; Tukey HSD: vehicle > MAL3-101 and PS-341 combination. (b) Overall condition effect on day 9: F(3,10) = 5.25; P = 0.02; Tukey HSD: vehicle > MAL3-101 and PS-341 combination. (c) Overall condition effect on day 13: F(3,10) = 10.57; P = 0.002; Tukey HSD: vehicle > MAL3-101 and PS-341 combination; vehicle > PS-341. (d) Overall condition effect on day 16: F(3,10) = 8.16; P = 0.004; Tukey HSD: vehicle > MAL3­-101 and PS-341 combination; vehicle > PS-341. (e) Overall condition effect on day 20: F(3,10) = 7.33; P = 0.01; Tukey HSD: vehicle > MAL3­-101 and PS-341 combination; vehicle > PS-341. (B) The bar graph shows the computed mean percentage difference for each treatment versus vehicle. An overall condition effect was noted (F(2,7) = 10.25; P = 0.008). Treatment with combination of PS-341 and MAL3-101 was significantly more effective on percent tumor inhibition in comparison to PS-341 or MAL3-101 alone (Tukey's HSD test, P = 0.02; P = 0.008, resp.), although each individual treatment was not significantly different from each other. *indicates statistical significance. Vertical bars denote 0.95 confidence interval.

References

    1. Fewell SW, Smith CM, Lyon MA, et al. Small molecule modulators of endogenous and co-chaperone-stimulated Hsp70 ATPase activity. Journal of Biological Chemistry. 2004;279(49):51131–51140. - PubMed
    1. Rajkumar SV. Multiple myeloma: 2011 update on diagnosis, risk-stratification, and management. American Journal of Hematology. 2011;86(1):57–65. - PubMed
    1. Barlogie B, Kyle RA, Anderson KC, et al. Standard chemotherapy compared with high-dose chemoradiotherapy for multiple myeloma: final results of phase III US intergroup trial S9321. Journal of Clinical Oncology. 2006;24(6):929–936. - PubMed
    1. Richardson PG, Weller E, Lonial S, et al. Lenalidomide, bortezomib, and dexamethasone combination therapy in patients with newly diagnosed multiple myeloma. Blood. 2010;116(5):679–686. - PMC - PubMed
    1. Bergsagel PL, Kuehl WM. Molecular pathogenesis and a consequent classification of multiple myeloma. Journal of Clinical Oncology. 2005;23(26):6333–6338. - PubMed

LinkOut - more resources