

Sensing surface PEGylation with microcantilevers
- PMID: 21977390
- PMCID: PMC3045929
- DOI: 10.3762/bjnano.1.2
Sensing surface PEGylation with microcantilevers
Abstract
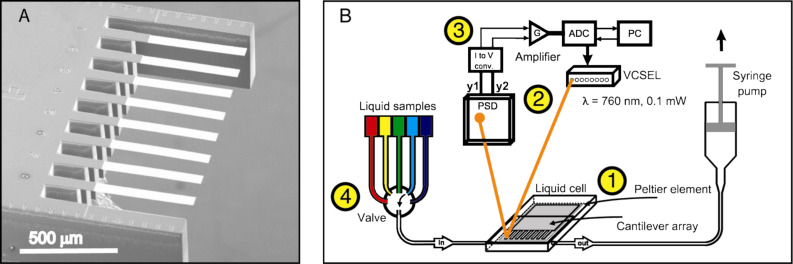
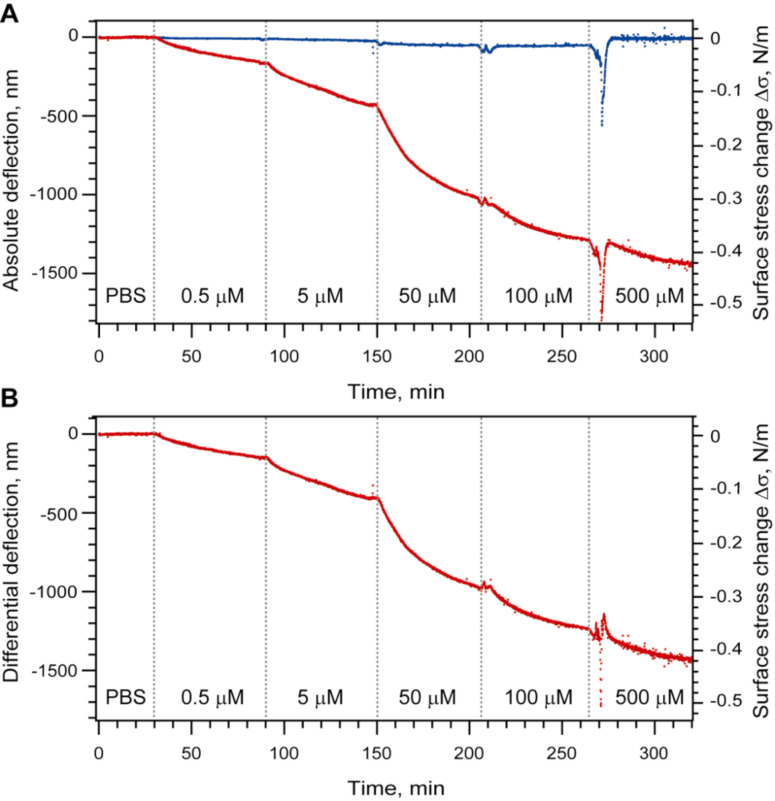
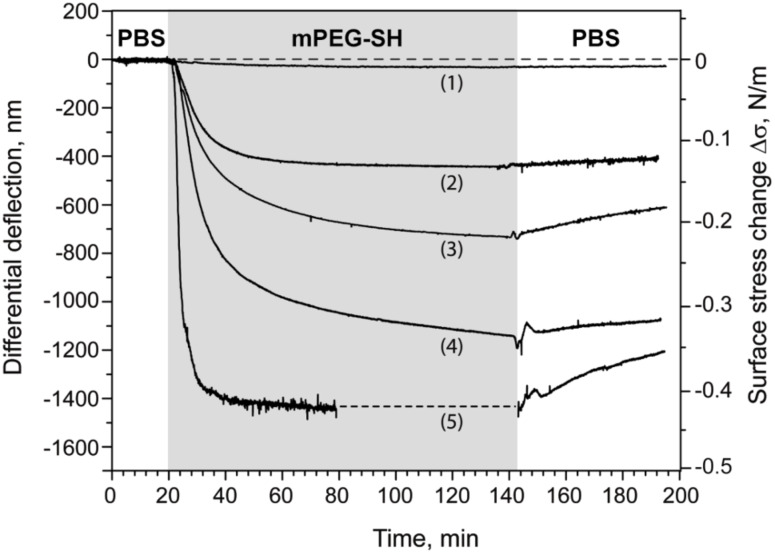
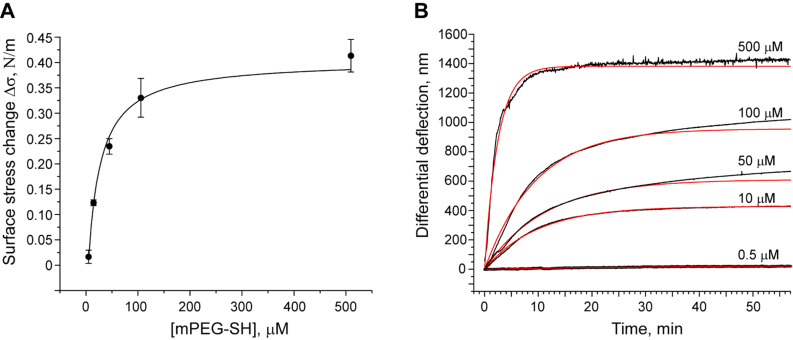
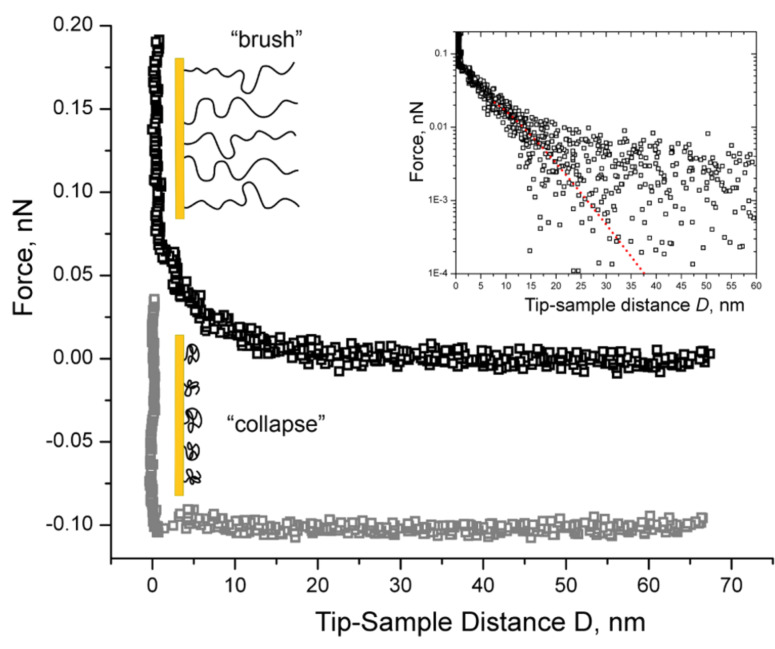
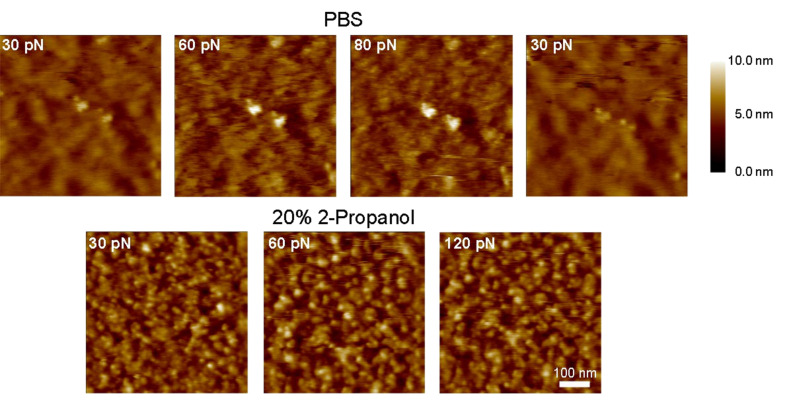
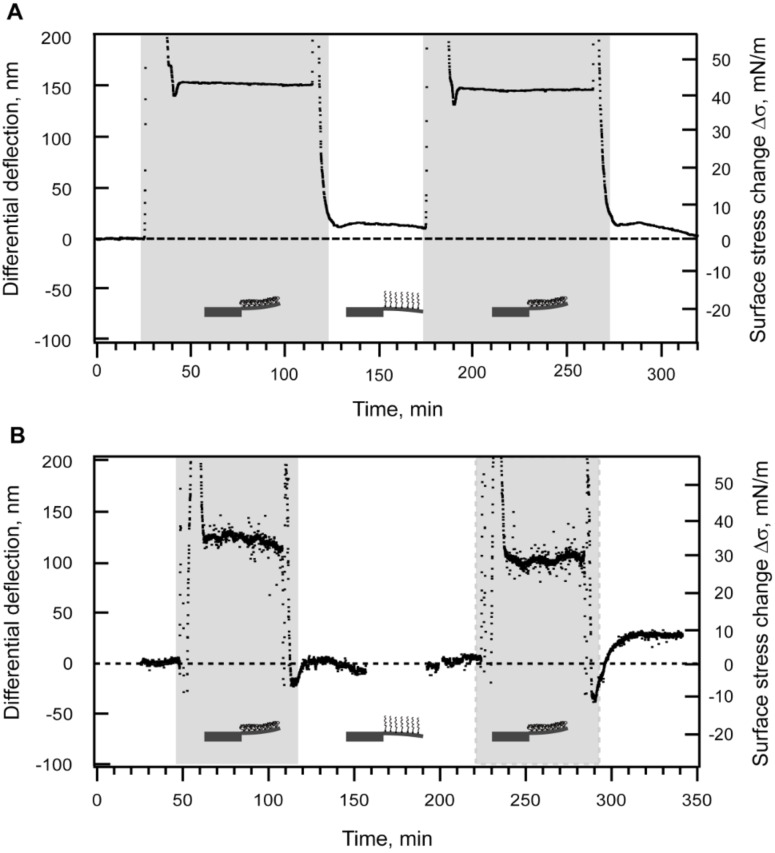
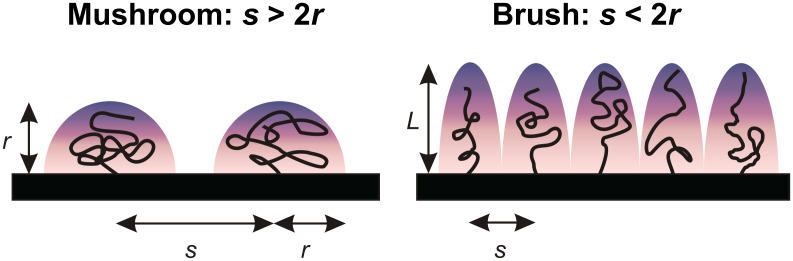
Polymers are often used to modify surface properties to control interfacial processes. Their sensitivity to solvent conditions and ability to undergo conformational transitions makes polymers attractive in tailoring surface properties with specific functionalities leading to applications in diverse areas ranging from tribology to colloidal stability and medicine. A key example is polyethylene glycol (PEG), which is widely used as a protein-resistant coating given its low toxicity and biocompatibility. We report here a microcantilever-based sensor for the in situ characterization of PEG monolayer formation on Au using the "grafting to" approach. Moreover, we demonstrate how microcantilevers can be used to monitor conformational changes in the grafted PEG layer in different solvent conditions. This is supported by atomic force microscope (AFM) images and force-distance curve measurements of the microcantilever chip surface, which show that the grafted PEG undergoes a reversible collapse when switching between good and poor solvent conditions, respectively.
Keywords: AFM; cantilever sensor; polyethylene glycol; polymer brush; reversible collapse; static mode.
Figures
Similar articles
-
Interaction forces and reversible collapse of a polymer brush-gated nanopore.ACS Nano. 2009 Oct 27;3(10):2911-8. doi: 10.1021/nn900152m. ACS Nano. 2009. PMID: 19728698
-
Erratum: Preparation of Poly(pentafluorophenyl acrylate) Functionalized SiO2 Beads for Protein Purification.J Vis Exp. 2019 Apr 30;(146). doi: 10.3791/6328. J Vis Exp. 2019. PMID: 31038480
-
Relationship between interfacial forces measured by colloid-probe atomic force microscopy and protein resistance of poly(ethylene glycol)-grafted poly(L-lysine) adlayers on niobia surfaces.Langmuir. 2005 Jul 5;21(14):6508-20. doi: 10.1021/la050386x. Langmuir. 2005. PMID: 15982060
-
Review: Cantilever-Based Sensors for High Speed Atomic Force Microscopy.Sensors (Basel). 2020 Aug 25;20(17):4784. doi: 10.3390/s20174784. Sensors (Basel). 2020. PMID: 32854193 Free PMC article. Review.
-
Microcantilever biosensors.Methods. 2005 Sep;37(1):57-64. doi: 10.1016/j.ymeth.2005.05.011. Epub 2005 Sep 30. Methods. 2005. PMID: 16199177 Review.
Cited by
-
Unraveling the Phase Behavior, Mechanical Stability, and Protein Reconstitution Properties of Polymer-Lipid Hybrid Vesicles.Biomacromolecules. 2023 Sep 11;24(9):4156-4169. doi: 10.1021/acs.biomac.3c00498. Epub 2023 Aug 4. Biomacromolecules. 2023. PMID: 37539954 Free PMC article.
-
Cucurbit[8]uril directed stimuli-responsive supramolecular polymer brushes for dynamic surface engineering.Chem Sci. 2015 Sep 1;6(9):5303-5310. doi: 10.1039/c5sc01496d. Epub 2015 Jul 6. Chem Sci. 2015. PMID: 28717504 Free PMC article.
-
Lectin-functionalized mesoporous silica nanoparticles for endoscopic detection of premalignant colonic lesions.Nanomedicine. 2017 Aug;13(6):1941-1952. doi: 10.1016/j.nano.2017.03.014. Epub 2017 Mar 29. Nanomedicine. 2017. PMID: 28363770 Free PMC article.
-
Multivalent ions induce lateral structural inhomogeneities in polyelectrolyte brushes.Sci Adv. 2017 Dec 8;3(12):eaao1497. doi: 10.1126/sciadv.aao1497. eCollection 2017 Dec. Sci Adv. 2017. PMID: 29226245 Free PMC article.
-
Click-Chemistry-Enabled Functionalization of Cellulose Nanocrystals with Single-Stranded DNA for Directed Assembly.ACS Biomater Sci Eng. 2024 Oct 14;10(10):6155-6166. doi: 10.1021/acsbiomaterials.4c01518. Epub 2024 Sep 11. ACS Biomater Sci Eng. 2024. PMID: 39259018 Free PMC article.
References
LinkOut - more resources
Full Text Sources
Miscellaneous