. 2011 Sep;38(9):4971-81.
doi: 10.1118/1.3618729.

The effect of electronically steering a phased array ultrasound transducer on near-field tissue heating

Affiliations

The effect of electronically steering a phased array ultrasound transducer on near-field tissue heating

Allison Payne et al. Med Phys. 2011 Sep.

Abstract

Purpose: This study presents the results obtained from both simulation and experimental techniques that show the effect of mechanically or electronically steering a phased array transducer on proximal tissue heating.

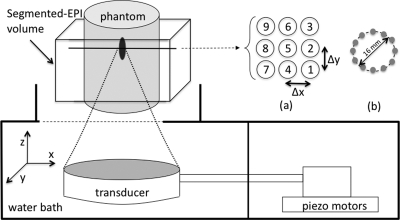
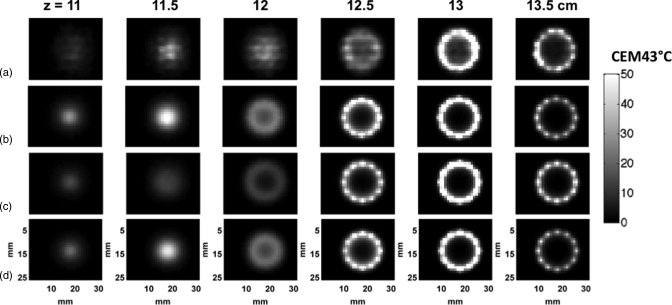
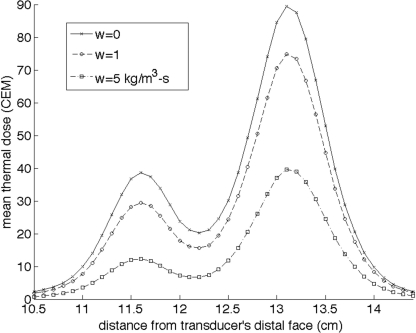
Methods: The thermal response of a nine-position raster and a 16-mm diameter circle scanning trajectory executed through both electronic and mechanical scanning was evaluated in computer simulations and experimentally in a homogeneous tissue-mimicking phantom. Simulations were performed using power deposition maps obtained from the hybrid angular spectrum (HAS) method and applying a finite-difference approximation of the Pennes' bioheat transfer equation for the experimentally used transducer and also for a fully sampled transducer to demonstrate the effect of acoustic window, ultrasound beam overlap and grating lobe clutter on near-field heating.

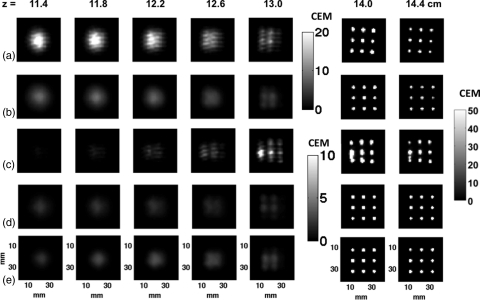
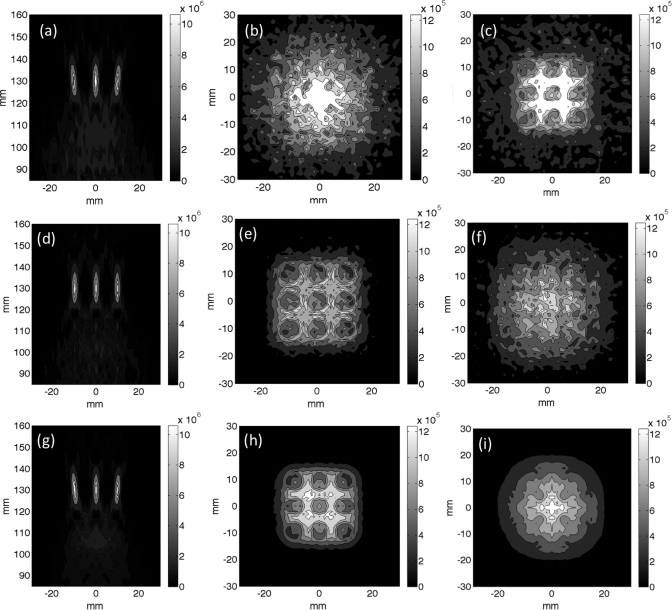
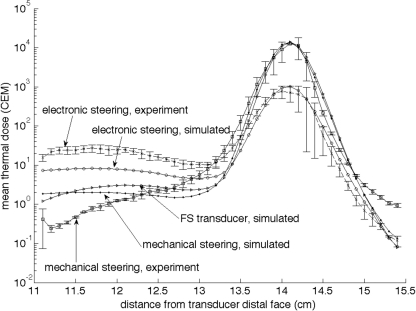
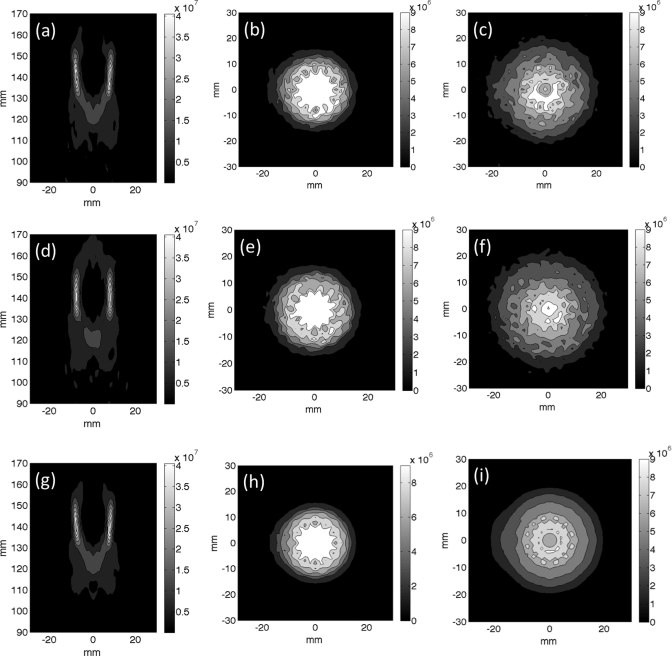
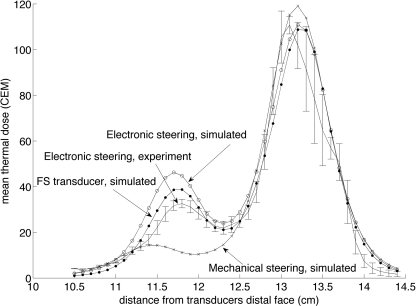
Results: Both simulation and experimental results show that electronically steering the ultrasound beam for the two trajectories using the 256-element phased array significantly increases the thermal dose deposited in the near-field tissues when compared with the same treatment executed through mechanical steering only. In addition, the individual contributions of both beam overlap and grating lobe clutter to the near-field thermal effects were determined through comparing the simulated ultrasound beam patterns and resulting temperature fields from mechanically and electronically steered trajectories using the 256-randomized element phased array transducer to an electronically steered trajectory using a fully sampled transducer with 40 401 phase-adjusted sample points.

Conclusions: Three distinctly different three distinctly different transducers were simulated to analyze the tradeoffs of selected transducer design parameters on near-field heating. Careful consideration of design tradeoffs and accurate patient treatment planning combined with thorough monitoring of the near-field tissue temperature will help to ensure patient safety during an MRgHIFU treatment.


Figures

Figure 1
Figure 1
Schematic of the experimental setup. The phased array transducer, tissue-mimicking phantom, 3D segmented EPI volume location, and scan path patterns in an x-y plane projection are all shown. (a) Nine-point scanning pattern, Δx = Δy = 1 cm. (b) Twelve-point, 16-mm diameter circular scanning pattern.
Figure 2
Figure 2
The experimental and simulated thermal dose maps accumulated in a tissue-mimicking phantom for the nine-point raster scan with the focal plane of the trajectory located at z = 14 cm. The electronically steered, (a) experimental, and (b) simulated thermal dose maps [33–49 W] are shown at distances measured from the transducer’s distal face. (The acoustic power ranges for each are given in square parentheses.) The mechanically steered (c) experimental and (d) simulated thermal dose maps [33 W] are also shown. (e) Simulated thermal dose maps for the fully sampled transducer electronically steered. The scale bar for the dose maps is 0–50 CEM43 °C at z = 14.0 and 14.4 cm, 0–20 CEM43 °C for (a) and (b) and 0–10 CEM43 °C for (c)–(e) at z = 11.4–13.0 cm.
Figure 3
Figure 3
Superposition of the simulated power deposition patterns used in the thermal simulations presented in Figs. 24 for the nine-point raster trajectory. (a)–(c) Superimposed beam patterns for the electronically steered trajectory for (a) an axial slice, (b) transverse slice 1.5 cm proximal to the focal plane, and (c) transverse slice 2.5 cm proximal to the focal plane. (d)–(f) Superimposed beam patterns for the mechanically steered trajectory for (d) an axial slice, (e) transverse slice 1.5 cm proximal to the focal plane and (f) transverse slice 2.5 cm proximal to the focal plane. (g)–(i) Superimposed beam patterns for the fully sampled transducer electronically steered trajectory for (g) an axial slice, (h) transverse slice 1.5 cm proximal to the focal plane and (i) transverse slice 2.5 cm proximal to the focal plane. All scale bars have the units of Watts per cubic meter.
Figure 4
Figure 4
Log plot of the mean of the 25 voxels with the highest thermal dose (CEM43 °C) accumulated in planes perpendicular to the ultrasound beam’s axis during the nine-position raster trajectory as a function of distance from the transducer face. The error bars for the experimental data at each point represent one standard deviation (n = 3). The focal plane is located at z = 14 cm. Both simulated and experimental data are shown for both electronic and mechanical steering. The simulation of the electronically steered fully sampled (FS) transducer is also shown.
Figure 5
Figure 5
Superposition of the simulated power deposition patterns used in the thermal simulations presented in Figs. 67 for the 12 point, 16 mm circular trajectory. (a)–(c) Superimposed beam patterns for the electronically steered trajectory for (a) an axial slice, (b) transverse slice 1.5 cm proximal to the focal plane, and (c) transverse slice 2.5 cm proximal to the focal plane. (d)–(f) Superimposed beam patterns for the mechanically steered trajectory for (d) an axial slice, (e) transverse slice 1.5 cm proximal to the focal plane and (f) transverse slice 2.5 cm proximal to the focal plane. (g)–(i) Superimposed beam patterns for the fully sample transducer electronically steered trajectory for (g) an axial slice, (h) transverse slice 1.5 cm proximal to the focal plane and (i) transverse slice 2.5 cm proximal to the focal plane. All scale bars have units of Watts per cubic meter.
Figure 6
Figure 6
Thermal dose (in CEM43 °C) accumulated during the 16-mm circle trajectory in various x-y planes along the transducer’s axis for both electronically and mechanically steered trajectories. Electronically steered (a) experimental and (b) simulated data, (c) simulated mechanically steered data and (d) simulated electronically steered fully sampled transducer. The focal plane for the ultrasound beam is located at z = 13 cm. In all cases, the total sonication time was 60 s. The power for the electronically steered trajectory (both simulated and experimental) was 114 acoustic W to account for steering losses. The mechanically steered trajectory power input was 108 W.
Figure 7
Figure 7
Mean of the 25 voxels with the highest thermal dose (CEM43 °C) accumulated in planes perpendicular to the transducer’s axis for the 16-mm circular trajectory. The focal plane is at 13 cm. Both experimental and simulated results are displayed for electronic steering, and simulated data for the mechanically steered trajectory, and the electronically steered fully sampled (FS) transducer. The error bars for the experimental data at each point represent one standard deviation (n = 3).
Figure 8
Figure 8
Effect of perfusion on the mean of the 25 voxels with the highest thermal dose accumulated in planes perpendicular to the transducer’s axis for the 16-mm circle trajectory. Pennes’ perfusion values of 0,1, and 5 kg∕m3-s are shown. The focal plane for the ultrasound beam is located at z = 13 cm.
Figure 9
Figure 9
Mean of the 25 voxels with the highest power deposition Q as a function of distance from the transducer’s distal face for three different transducer configurations of (a) an unsteered beam at the geometric focus, (b) a beam steered 1 cm away from the transducer axially, and (c) a beam steered 1 cm off-axis in both the x and y transverse directions. The power deposition for each transducer is normalized to the mean power deposition in the peak 25 voxels at the geometric focus for transducer #1.

Similar articles

Cited by

References

    1. Wu X. and Sherar M., “Theoretical evaluation of moderately focused spherical transducers and multi-focus acoustic lens/transducer systems for ultrasound thermal therapy,” Phys. Med. Biol. 47(9), 1603–1621 (2002). 10.1088/0031-9155/47/9/313 - DOI - PubMed
    1. Fan X. and Hynynen K., “Ultrasound surgery using multiple sonications—treatment time considerations,” Ultrasound Med. Biol. 22(4), 471–482 (1996).10.1016/0301-5629(96)00026-9 - DOI - PubMed
    1. Daum D. R. and Hynynen K., “Thermal dose optimization via temporal switching in ultrasound surgery,” IEEE Trans. Ultrason. Ferroelectr. Freq. Control 45(1), 208–215 (1998).10.1109/58.646926 - DOI - PubMed
    1. Clay A. C., Wooh S.-C., Azar L., and Wang J.-Y., “Experimental Study of Phased Array Beam Steering Characteristics,” Journal of Nondestructive Evaluation 18 (2), 59–71 (1999).10.1023/A:1022618321612 - DOI
    1. de Senneville B. D., Mougenot C., and Moonen C. T., “Real-time adaptive methods for treatment of mobile organs by MRI-controlled high-intensity focused ultrasound,” Magn. Reson. Med. 57(2), 319–330 (2007).10.1002/mrm.v57:2 - DOI - PubMed

Publication types