

Overall and worst gleason scores are equally good predictors of prostate cancer progression
- PMID: 21978318
- PMCID: PMC3193164
- DOI: 10.1186/1471-2490-11-21
Overall and worst gleason scores are equally good predictors of prostate cancer progression
Abstract
Background: Gleason scoring has experienced several modifications during the past decade. So far, only one study has compared the prognostic abilities of worst (WGS) and overall (OGS) modified Gleason scores after the ISUP 2005 conference. Prostatic needle biopsies are individually paraffin-embedded in 57% of European pathology laboratories, whereas the rest of laboratories embed multiple (2 - 6) biopsies per one paraffin-block. Differences in the processing method can have a far-reaching effect, because reporting of the Gleason score (GS) is different for individually embedded and pooled biopsies, and GS is one of the most important factors when selecting treatment for patients.
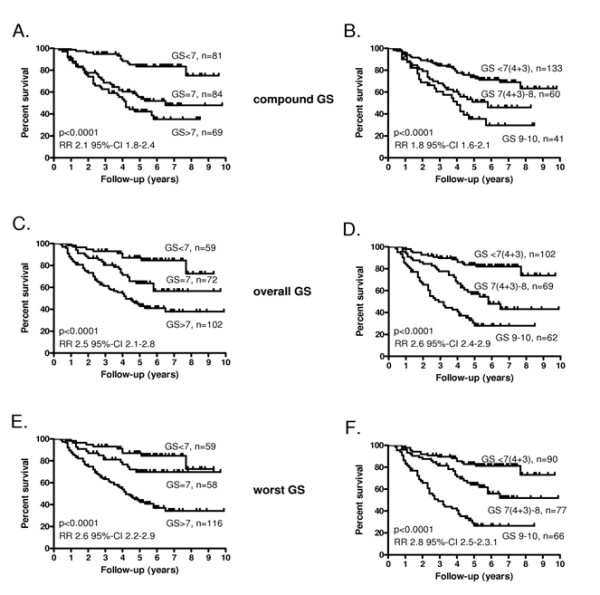
Methods: The study material consisted of needle biopsies from 236 prostate cancer patients that were endocrine-treated in 1999-2003. Biopsies from left side and right side were embedded separately. Haematoxylin-eosin-stained slides were scanned and analyzed on web-based virtual microscopy. Worst and overall Gleason scores were assessed according to the modified Gleason score schema after analyzing each biopsy separately. The compound Gleason scores (CGS) were obtained from the original pathology reports. Two different grade groupings were used: GS 6 or less vs. 7 vs. 8 or above; and GS 7(3 + 4) or less vs. 7(4 + 3) and 8 vs. 9-10. The prognostic ability of the three scoring methods to predict biochemical progression was compared with Kaplan-Meier survival analysis and univariate and multivariate Cox regression analyses.
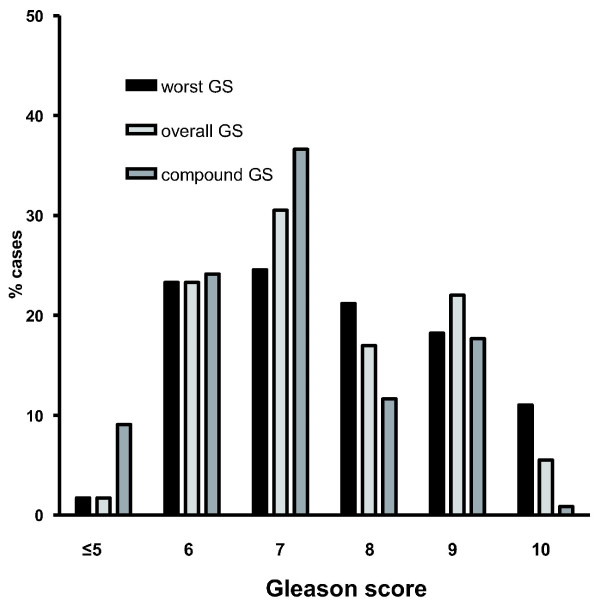
Results: The median follow-up time of the patients was 64.5 months (range 0-118). The modified GS criteria led to upgrading of the Gleason sums compared to the original CGS from the pathology reports 1999-2003 (mean 7.0 for CGS, 7.5 for OGS, 7.6 for WGS). In 43 cases WGS was > OGS. In a univariate analysis the relative risks were 2.1 (95%-confidence interval 1.8-2.4) for CGS, 2.5 (2.1-2.8) for OGS, and 2.6 (2.2-2.9) for WGS. In a multivariate analysis, OGS was the only independent prognostic factor.
Conclusions: All of the three Gleason scoring methods are strong predictors of biochemical recurrence. The use of modified Gleason scoring leads to upgrading of GS, but also improves the prognostic value of the scoring. No significant prognostic differences between OGS and WGS could be shown, which may relate to the apparent narrowing of the GS scale from 2-10 to 5-10 due to the recent modifications.
Figures
References
-
- Epstein JI, Allsbrook WC Jr, Amin MB, Egevad L. The ISUP Grading Committee. The 2005 International Society of Urological Pathology (ISUP) Consensus Conference on Gleason Grading of Prostatic Carcinoma. Am J Surg Pathol. 2005;29:228–242. - PubMed
-
- Kunju LP, Daignault S, Wei JT, Shah RB. Multiple prostate cancer cores with different Gleason grades submitted in the same specimen container without specific site designation: should each core be assigned an individual Gleason score? Hum Pathol. 2009;40:558–564. doi: 10.1016/j.humpath.2008.07.020. - DOI - PubMed
Publication types
MeSH terms
LinkOut - more resources
Full Text Sources
Medical
Miscellaneous
