

Human brain atlas-based multimodal MRI analysis of volumetry, diffusimetry, relaxometry and lesion distribution in multiple sclerosis patients and healthy adult controls: implications for understanding the pathogenesis of multiple sclerosis and consolidation of quantitative MRI results in MS
- PMID: 21978603
- PMCID: PMC3254796
- DOI: 10.1016/j.jns.2011.09.015
Human brain atlas-based multimodal MRI analysis of volumetry, diffusimetry, relaxometry and lesion distribution in multiple sclerosis patients and healthy adult controls: implications for understanding the pathogenesis of multiple sclerosis and consolidation of quantitative MRI results in MS
Abstract
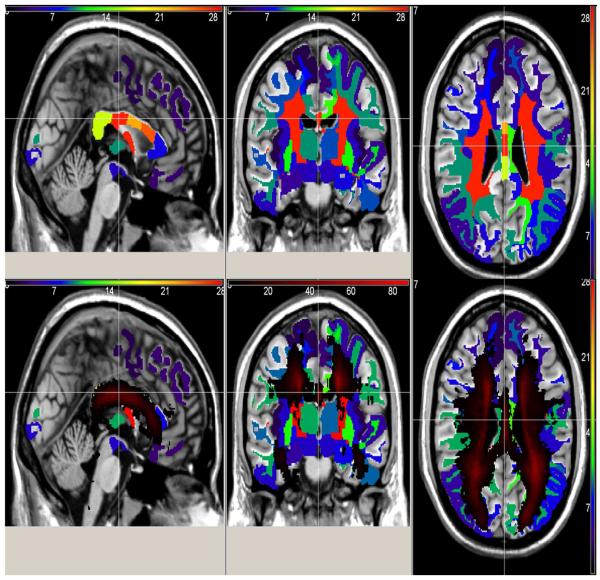
Multiple sclerosis (MS) is the most common immune-mediated disabling neurological disease of the central nervous system. The pathogenesis of MS is not fully understood. Histopathology implicates both demyelination and axonal degeneration as the major contributors to the accumulation of disability. The application of several in vivo quantitative magnetic resonance imaging (MRI) methods to both lesioned and normal-appearing brain tissue has not yet provided a solid conclusive support of the hypothesis that MS might be a diffuse disease. In this work, we adopted FreeSurfer to provide standardized macrostructure or volumetry of lesion free normal-appearing brain tissue in combination with multiple quantitative MRI metrics (T(2) relaxation time, diffusion tensor anisotropy and diffusivities) that characterize tissue microstructural integrity. By incorporating a large number of healthy controls, we have attempted to separate the natural age-related change from the disease-induced effects. Our work shows elevation in diffusivity and relaxation times and reduction in volume in a number of normal-appearing white matter and gray matter structures in relapsing-remitting multiple sclerosis patients. These changes were related in part with the spatial distribution of lesions. The whole brain lesion load and age-adjusted expanded disability status score showed strongest correlations in regions such as corpus callosum with qMRI metrics that are believed to be specific markers of axonal dysfunction, consistent with histologic data of others indicating axonal loss that is independent of focal lesions. Our results support that MS at least in part has a neurodegenerative component.
Copyright © 2011 Elsevier B.V. All rights reserved.
Figures
References
-
- Barnett MH, Prineas JW. Relapsing and remitting multiple sclerosis: pathology of the newly forming lesion. Ann Neurol. 2004;55:458–68. - PubMed
-
- Seewann A, Vrenken H, van der Valk P, Blezer EL, Knol DL, Castelijns JA, et al. Diffusely abnormal white matter in chronic multiple sclerosis: imaging and histopathologic analysis. Arch Neurol. 2009;66:601–9. - PubMed
-
- Trapp BD, Peterson J, Ransohoff RM, Rudick R, Mork S, Bo L. Axonal transection in the lesions of multiple sclerosis. New Engl J Med. 1998;338:278–85. - PubMed
-
- D’haeseleer M, Cambron M, Vanopdenbosch L, De Keyser J. Vascular aspects of multiple sclerosis. Lancet Neurol. 2011;10:657–66. - PubMed
Publication types
MeSH terms
Grants and funding
LinkOut - more resources
Full Text Sources
Medical
