. 2011 Oct 6:5:157.
doi: 10.1186/1752-0509-5-157.

Genomic phenotyping of the essential and non-essential yeast genome detects novel pathways for alkylation resistance

Affiliations

Genomic phenotyping of the essential and non-essential yeast genome detects novel pathways for alkylation resistance

J Peter Svensson et al. BMC Syst Biol. .

Abstract

Background: A myriad of new chemicals has been introduced into our environment and exposure to these agents can damage cells and induce cytotoxicity through different mechanisms, including damaging DNA directly. Analysis of global transcriptional and phenotypic responses in the yeast S. cerevisiae provides means to identify pathways of damage recovery upon toxic exposure.

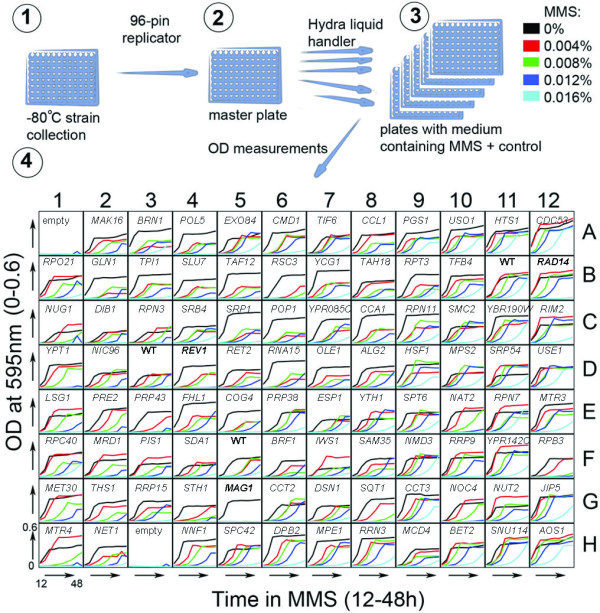
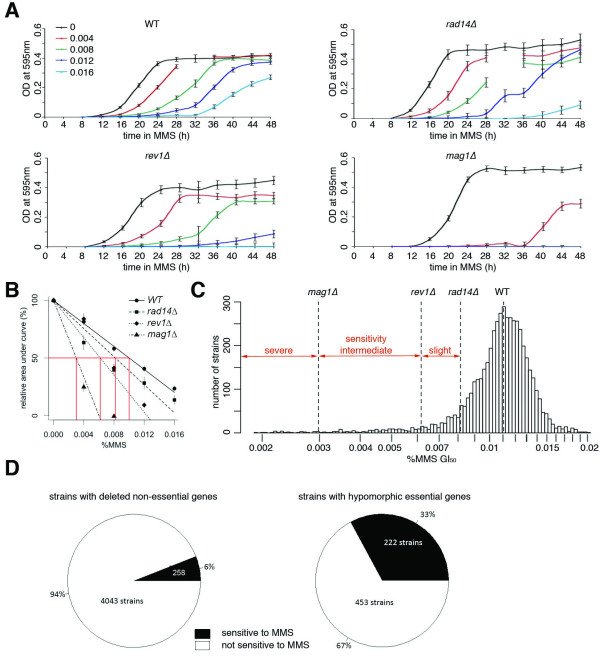
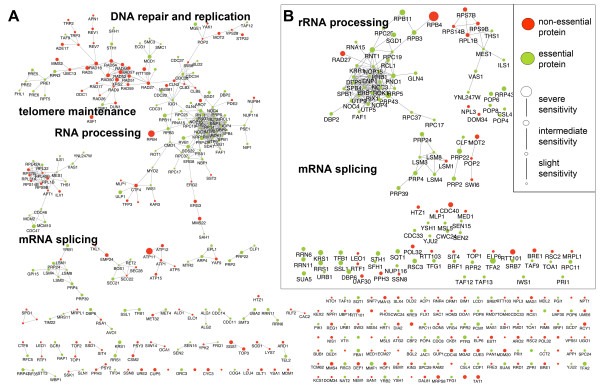
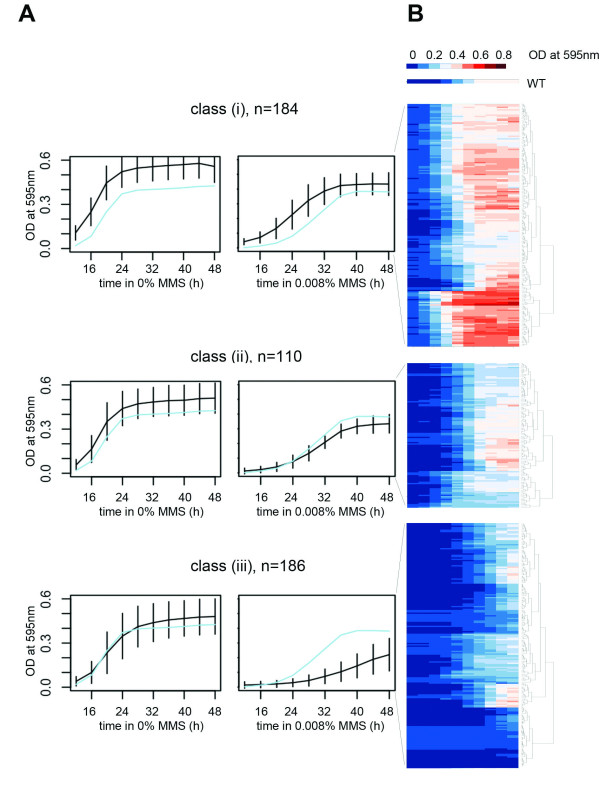
Results: Here we present a phenotypic screen of S. cerevisiae in liquid culture in a microtiter format. Detailed growth measurements were analyzed to reveal effects on ~5,500 different haploid strains that have either non-essential genes deleted or essential genes modified to generate unstable transcripts. The pattern of yeast mutants that are growth-inhibited (compared to WT cells) reveals the mechanisms ordinarily used to recover after damage. In addition to identifying previously-described DNA repair and cell cycle checkpoint deficient strains, we also identified new functional groups that profoundly affect MMS sensitivity, including RNA processing and telomere maintenance.

Conclusions: We present here a data-driven method to reveal modes of toxicity of different agents that impair cellular growth. The results from this study complement previous genomic phenotyping studies as we have expanded the data to include essential genes and to provide detailed mutant growth analysis for each individual strain. This eukaryotic testing system could potentially be used to screen compounds for toxicity, to identify mechanisms of toxicity, and to reduce the need for animal testing.


Figures

Figure 1
Figure 1
Schematic of the experimental procedure. (1) Cells are kept at -80°C from where they are pin-replicated and (2) grown to stationary phase in a master plate. (3) Once in stationary phase, the cultures are robotically diluted in YPD media (using a Hydra liquid handler) containing increasing doses of MMS (0-0.016% final concentration). (4) After incubation at 25°C for 12 hours, optical densities of all cultures are measured every 4 h until 48 h post-treatment. Growth curves are plotted and data is analyzed. As an example, plate 1 from the DAmP library is shown with the name of gene deleted in each strain given above the growth curves. Every plate contains control strains (in bold), WT (B11, D3, F5), rad14Δ (B12), rev1Δ (D4) and mag1Δ (G5), as well as at least two empty wells, containing media only.
Figure 2
Figure 2
Determination of sensitivity phenotype of the tested strains. A) Growth curves of the controls - WT and the sensitive strains rad14Δ, rev1Δ, and mag1Δ - during 12-48 h after insult with increasing doses of alkylating agent MMS. A few data points at 32 h were undersampled and showed large variation. These points were omitted from the graphs. B) The area under the growth curves were plotted against the dose to calculate the dose that result in 50% growth inhibition (GI50). The data for the four control strains are shown. Error bars represents the s.e.m. C) Histograms of showing the distribution of GI50 from the entire tested panel (both deletion and DAmP strains), with the GI50 of the four control strains forming the limits between severe, intermediate and slight sensitivity to MMS. The WT strain has been transfected with a plasmid conferring G418 resistance that alters the sensitivity of the strain slightly. D) Pie charts of sensitivities of the strains lacking (left) non-essential genes (deletion strains) and (right) essential genes (DAmP strains).
Figure 3
Figure 3
Yeast protein-protein interaction networks. A) Network of proteins whose absence or reduced levels render cells sensitive to MMS B) Sub-network of these proteins involved in RNA processing. Non-essential proteins are in red, essential proteins in green. The size (inverse to the GI50-value) reflects the sensitivity to MMS of the corresponding yeast strains. Classification of severe, intermediate and slight sensitivity was established according to GI50 values (GI50<0.003%, GI50<0.006% and GI50<0.008%, respectively).
Figure 4
Figure 4
Comparison between results of liquid genomic phenotyping (this study) and previous results using a solid agar assay (Begley et al, 2004). A) A boxplot of the previous dataset (x-axis) where the data ranges from 0 (no sensitivity to MMS) and 30 (high sensitivity to MMS) and the dataset presented here. The bold line represents the median, the box contains 50% of the data, the whiskers extend to 1.5 times the inter-quartile range, and outliers are represented by dots. Two lines (blue) are fitted with linear regression to the data, one in the range of sensitivity scores 0-7 and one in the range of sensitivity scores 7-20. B) Venn diagram showing the overlap in GO terms enriched in sensitive strains from the liquid assay and the agar assay.
Figure 5
Figure 5
The strains with intermediate sensitivity are divided into classes based on their growth phenotype after exposure to 0.008% MMS. A) Through self-organizing maps, three classes were identified based on the growth curves after MMS exposure. WT is shown as a reference in light blue. The black lines show the average values within the class for each time point. B) Hierarchical clustering and heatmaps of the three clusters in A. The growth of the WT strain is shown at the top.

References

    1. Begley TJ, Rosenbach AS, Ideker T, Samson LD. Damage recovery pathways in Saccharomyces cerevisiae revealed by genomic phenotyping and interactome mapping. Molecular Cancer Research. 2002;1(2):103–112. - PubMed
    1. Begley TJ, Rosenbach AS, Ideker T, Samson LD. Hot spots for modulating toxicity identified by genomic phenotyping and localization mapping. Molecular Cell. 2004;16(1):117–125. - PubMed
    1. Jelinsky SA, Estep P, Church GM, Samson LD. Regulatory networks revealed by transcriptional profiling of damaged Saccharomyces cerevisiae cells: Rpn4 links base excision repair with proteasomes. Molecular and Cellular Biology. 2000;20(21):8157–8167. doi: 10.1128/MCB.20.21.8157-8167.2000. - DOI - PMC - PubMed
    1. Jelinsky SA, Samson LD. Global response of Saccharomyces cerevisiae to an alkylating agent. Proceedings of the National Academy of Sciences of the United States of America. 1999;96(4):1486–1491. doi: 10.1073/pnas.96.4.1486. - DOI - PMC - PubMed
    1. Chang M, Bellaoui M, Boone C, Brown GW. A genome-wide screen for methyl methanesulfonate-sensitive mutants reveals genes required for S phase progression in the presence of DNA damage. Proceedings of the National Academy of Sciences of the United States of America. 2002;99(26):16934–16939. doi: 10.1073/pnas.262669299. - DOI - PMC - PubMed

Publication types