. 2011:3:1039-52.
doi: 10.1093/gbe/evr052.

Evolution under environmental stress at macro- and microscales

Affiliations

Evolution under environmental stress at macro- and microscales

Eviatar Nevo. Genome Biol Evol. 2011.

Abstract

Environmental stress has played a major role in the evolution of living organisms (Hoffman AA, Parsons PA. 1991. Evolutionary genetics and environmental stress. Oxford: Oxford University Press; Parsons PA. 2005. Environments and evolution: interactions between stress, resource inadequacy, and energetic efficiency. Biol Rev Camb Philos Soc. 80:589-610). This is reflected by the massive and background extinctions in evolutionary time (Nevo E. 1995a. Evolution and extinction. Encyclopedia of Environmental Biology. New York: Academic Press, Inc. 1:717-745). The interaction between organism and environment is central in evolution. Extinction ensues when organisms fail to change and adapt to the constantly altering abiotic and biotic stressful environmental changes as documented in the fossil record. Extreme environmental stress causes extinction but also leads to evolutionary change and the origination of new species adapted to new environments. I will discuss a few of these global, regional, and local stresses based primarily on my own research programs. These examples will include the 1) global regional and local experiment of subterranean mammals; 2) regional experiment of fungal life in the Dead Sea; 3) evolution of wild cereals; 4) "Evolution Canyon"; 5) human brain evolution, and 6) global warming.


Figures

F<sc>IG</sc>. 1.—
FIG. 1.—
Distribution of subterranean mammals across the planet. Palearctic region: Talpa (Talpidae, insectivores), Spalax (Spalacidae, rodents; SE Europe, Turkey, Near East, N. Africa) and Ellobius (Arvicolidae, rodents; Asia); Ethopian: Chrysochloris and Amblysomus (Chrosochloridae, insectivores; S. Africa), Tachyoryctes (Rhizomyidae, rodents: S. Africa); Oriental: Scaptonyx and Urotrichus (Talpidae, insectivores; E. Asia) and Rhizomys (Rhizomyidae, rodents); Australian: Notoryctes (Nortorctidae, marsupial moles; Australia); Nearctic: Scalopus and Scapanus (Talpidae, insectivores) and Geomys (Geomyidae, rodents); Neotropical: Spalacopus (Octodontidae, rodents), Ctenomys (Ctenomyidae, rodents), and Clyomys (Echimyidae, rodents). Different symbols mark the different zoogeographical regions. (From Prof Hynek Burda, a personal slide.)
F<sc>IG</sc>. 2.—
FIG. 2.—
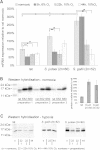
Neuroglobin (Ngb) expression quantification. (A) Ngb mRNA expression in total brain, quantified by quantitative reverse transcriptase polymerase chain reaction. Under normoxia, Ngb expression is 1.8- and 2.8-fold higher, respectively, in S. judaei and S. galili than in rat. In S. judaei and rat, severe short-time hypoxia (4 h, 6% O2) decreases Ngb mRNA to half of its normoxic value, whereas the amount in S. galili is unchanged. Longer term moderate hypoxia (22 and 44 h, 10 O2) decreases Ngb expression to 40–75% of the normoxic condition in all three species. Significance levels, indicated by asterisk and horizontal brackets, were obtained by the Student’s t-test: **P ≤ 0.01, *P ≤ 0.05, (*)P ≤ 0.1. (B) Western blot analysis of Ngb protein expression in rat, S. judaei (2n = 60; S60), and S. galili (2n = 52; S52) normoxic total brain. Three individuals of each species were tested (preparations 1–3). The blot, containing equal amounts of protein per lane, indicates an up to 3.5-fold higher Ngb protein level in the Spalax species as compared with rat. (C) Western blot analysis of Ngb in hypoxic versus normoxic (n) animals. In rat, we observe a slight downregulation after 22 or 44 h of moderate hypoxic stress (10% O2). In S. galili (S52) and S. judaei (S60), protein levels do not proportionately reflect the decreasing mRNA but show that there is no hypoxic upregulation of Ngb (from Avivi et al. 2010).
F<sc>IG</sc>. 3.—
FIG. 3.—
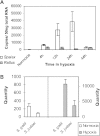
(A) Time course of Epo gene expression in Spalax and Rattus kidneys in normoxia and 10% hypoxia. The numbers of copies in 50 ng of total RNA in Spalax were 190 ± 57; 6,805 ± 946; 27,485 ± 8,322; 38,898 ± 13,548 and 3,177 ± 877; and the numbers in Rattus were 130 ± 53; 3,398 ± 898; 3,040 ± 963; 1,355 ± 209 and 2,691 ± 523 under normoxia and after 4, 12, 24, and 44 h of hypoxia, respectively (From Shams et al. 2004). (B) Comparative Epo gene expression in S. galili and S. judaei under normoxia and 6% O2 for 10 h. Spalax galili values were 269 ± 65 and 10, 687 ± 1,506 and S. judaei values were 85 ± 30 and 3,739 ± 1,620, under normoxia and hypoxia, respectively (from Shams et al. 2004).
F<sc>ig</sc>. 4.—
Fig. 4.—
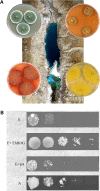
(A) Dead Sea with four species of its filamentous fungi: Penicillium crustosum, Aspergillus versicolor, Eurotium rubrum, and Eurotium anstelodami. (B) Transformation of the HOG gene into a mutant yeast and growth of the transformant in Dead Sea water with 250 mμ LiCl: (1) E = hog 1▵yeast mutant, (2) E + EhHOG: the transformant: hog1 yeast mutant containing HOG gene from the fungus E. herbariorum, EhHOG. (3) E + pA : hog1▵yeast mutant containing empty plasmid pADNS; (4) A = Wild-type yeast strain. Note that the growth of the transformant with EuHOG is best. (from Jin et al. 2005).
F<sc>IG</sc>. 5.—
FIG. 5.—
Microclimatic stress and adaptive RAPD DNA differentiation in wild emmer wheat, Triticum dicoccoides, from the Yehudiyya microsite, Golan. The test involved two climatic microniches in the open oak-park forest of Quercus ithaburensis (1) sunny between trees and (2) shady under the trees’ canopies. The histograms of frequencies of canonical scores show the difference between shady and sunny niches according to 25 polymorphic RAPD loci (from Li et al. 1999)
F<sc>IG</sc>. 6.—
FIG. 6.—
The four “Evolution Canyons” in Israel (EC I–IV). Note the plant formation on opposite slopes. The green lush, “European,” temperate, cool-mesic, north-facing slope (NFS) sharply contrasts with the open-park forest of the warm-xeric, tropical, “African-Asian” savanna on the south-facing slope (SFS). Note the interslope divergence in vegetation, even in EC III in the Negev desert where the SFS is covered by cyanobacteria and the NSF by lichens (from Nevo 2009).
F<sc>IG</sc>. 7.—
FIG. 7.—
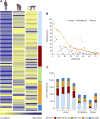
Higher RNA editing level in human versus nonhuman primates. (A) RNA editing levels of 75 sites in six transcripts originating from cerebellum tissues of four humans, two chimpanzees, and two rhesus monkeys were quantified after polymerase chain reaction amplification using the DS gene program. Average editing values were normalized (Z-score) and colored accordingly with blue-yellow gradient using the Spotfire program (Tibco). (B) RNA editing levels per site for humans, chimpanzees, and rhesus monkeys. The human editing sites are ordered in decreasing editing levels, and the nonhuman primate editing sites are aligned accordingly. (C) RNA editing levels in cerebellum tissues of eight individual primates: a total of the resulting editing level quantification in the six tested transcripts are plotted in four human, two chimpanzees, and two rhesus individuals where the bar size is proportional to the total of the editing levels in all tested sites (from Paz-Yaacov et al. 2010).
F<sc>IG</sc>. 8.—
FIG. 8.—
Possible effects of Alu architecture alterations on RNA editing. Schematic representation of the genomic Alu elements’ location and orientation: Alu elements are marked as arrow-shaped boxes in the human (blue) and monkey (red) genomes. Alterations between the species are indicated in orange. (A) Minor alteration in Alu sequence between the species. (B) Inversion of one of the Alu sequences along primate evolution. (C) Deletion of Alu element along evolution. (D) Insertion of additional Alu sequence along evolution (from Paz-Yaacov et al. 2010).
F<sc>IG</sc>. 9.—
FIG. 9.—
Analysis of newly inserted Alus. Among the 165 shared genes representing new (independent) Alu insertions in the human and the chimpanzee, 115 are neurological function and neurological-associated genes (from Paz-Yaacov et al. 2010). Upper right: Number of common human and chimpanzee genes showing new (independent) Alu element insertions. Among the 165 shared genes representing new independent Alu insertions in the human and chimpanzee, 115 are neurological function and neurological disease-associated genes (from Paz-Yaacov et al. 2010).

References

    1. Arieli R, Arieli M, Heth G, Nevo E. Adaptive respiratory variation in four chromosomal species of mole rats. Experientia. 1984;40:512–514. - PubMed
    1. Arieli R, Heth G, Nevo E, Hoch D. Hematocrit and hemoglobin concentration in four chromosomal species and some isolated populations of actively speciating subterranean mole rats in Israel. Experientia. 1986;42:441–443. - PubMed
    1. Arieli R, Heth G, Nevo E, Zamir Y, Neutra O. Adaptive heart and breathing frequencies in four ecologically differentiating chromosomal species of mole rats in Israel. Experientia. 1986;42:131–133.
    1. Arieli R, Nevo E. Hypoxic survival differs between two mole rat species (Spalax ehrenbergi) of humid and arid habitats. Comp Biochem Physiol A Comp Physiol. 1991;3:543–545. - PubMed
    1. Ashur-Fabian O, et al. Evolution of p53 in hypoxia-stress Spalax mimics human tumor mutation. Proc Natl Acad Sci U S A. 2004;101:12236–12241. - PMC - PubMed