Case Reports
. 2012 Feb 1;59(3):2860-70.
doi: 10.1016/j.neuroimage.2011.09.049. Epub 2011 Sep 29.

Roles for the pre-supplementary motor area and the right inferior frontal gyrus in stopping action: electrophysiological responses and functional and structural connectivity

Affiliations
Case Reports

Roles for the pre-supplementary motor area and the right inferior frontal gyrus in stopping action: electrophysiological responses and functional and structural connectivity

Nicole C Swann et al. Neuroimage. .

Abstract

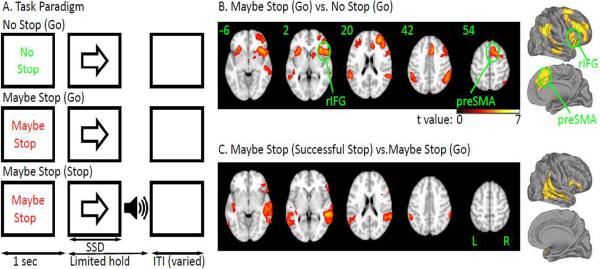
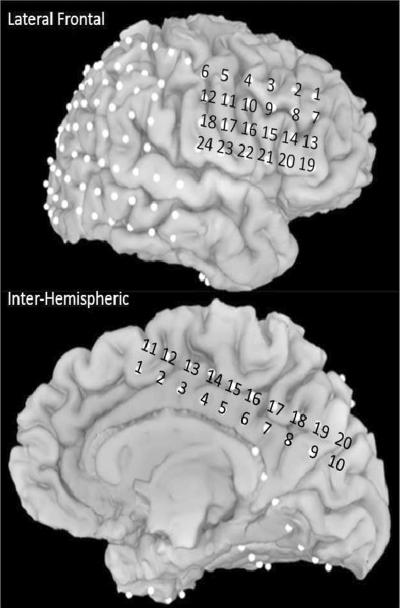
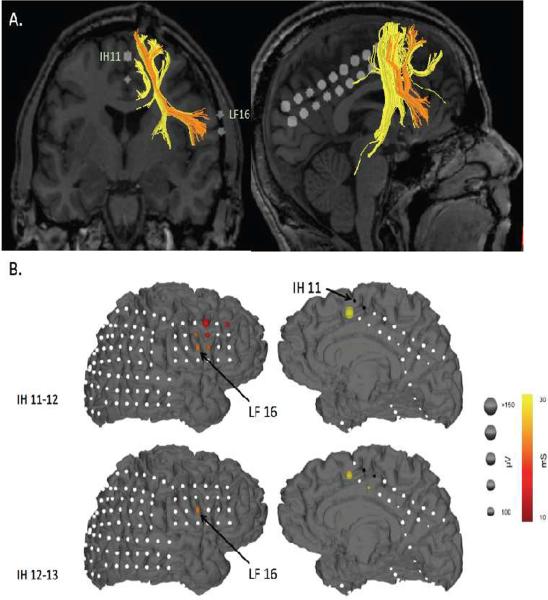
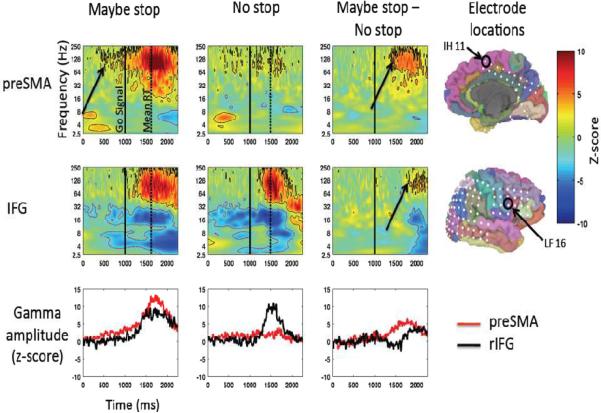
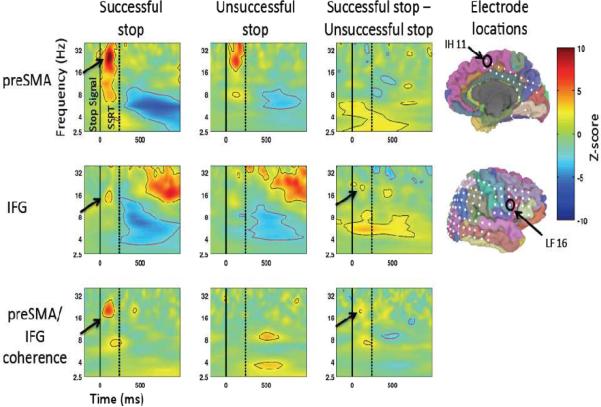
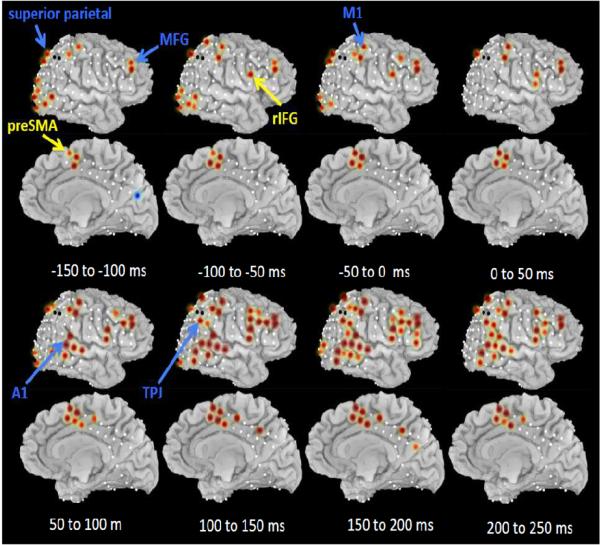
Both the pre-supplementary motor area (preSMA) and the right inferior frontal gyrus (rIFG) are important for stopping action outright. These regions are also engaged when preparing to stop. We aimed to elucidate the roles of these regions by harnessing the high spatio-temporal resolution of electrocorticography (ECoG), and by using a task that engages both preparing to stop and stopping outright. First, we validated the task using fMRI in 16 healthy control participants to confirm that both the preSMA and the rIFG were active. Next, we studied a rare patient with intracranial grid coverage of both these regions, using macrostimulation, diffusion tractography, cortico-cortical evoked potentials (CCEPs) and task-based ECoG. Macrostimulation of the preSMA induced behavioral motor arrest. Diffusion tractography revealed a structural connection between the preSMA and rIFG. CCEP analysis showed that stimulation of the preSMA evoked strong local field potentials within 30 ms in rIFG. During the task, when preparing to stop, there was increased high gamma amplitude (~70-250 Hz) in both regions, with preSMA preceding rIFG by ~750 ms. For outright stopping there was also a high gamma amplitude increase in both regions, again with preSMA preceding rIFG. Further, at the time of stopping, there was an increase in beta band activity (~16 Hz) in both regions, with significantly stronger inter-regional coherence for successful vs. unsuccessful stop trials. The results complement earlier reports of a structural/functional action control network between the preSMA and rIFG. They go further by revealing between-region timing differences in the high gamma band when preparing to stop and stopping outright. They also reveal strong between-region coherence in the beta band when stopping is successful. Implications for theories of action control are discussed.


Figures

Figure 1
Figure 1
A. Task. Each trial began with a cue (“Maybe Stop” or “No Stop”). Then, a left or right arrow (go signal) followed. Participants were instructed to quickly respond. On half the “Maybe Stop” trials, a beep (stop signal) was presented shortly after the go signal. Participants were instructed to try to inhibit their response when the beep was presented. B. Brain activation for preparing to stop. The contrast is MS_Go vs. NS_Go (z>2.3, p<0.05 cluster corrected); C. Brain activation for outright stopping. The contrast is MS_SS vs. MS_Go (z>2.3, p<0.05 cluster corrected).
Figure 2
Figure 2
Electrode locations for all electrodes in the preSMA and rIFG regions. IH = interhemispheric, LF = lateral frontal.
Figure 3
Figure 3
A. Diffusion Tensor Imaging. Ipsilateral tracts between the preSMA and the right lateral frontal cortex are shown (only fibers with a mean FA value of greater than 4 and a length > 20 mm were displayed). Note that IH11 (preSMA) specifically connects to LF16 (rIFG). B. Cortico-cortical Evoked Potentials. Evoked potentials occurring within 30 ms following stimulation of the IH electrodes overlying pre-SMA. Responses to 50 epochs were averaged and are diagrammatically represented for each stimulating pair. Stimulating electrodes are black, electrodes with no CCEPs are white. CCEP magnitude (peak) is represented by the size and the time to peak of the CCEP is represented by the color of the spheroids placed at site of the electrodes. Distinct and spatially specific responses were noted in rIFG and MFG with pre-SMA stimulation.
Figure 4
Figure 4
ECoG: Preparing to stop for preSMA and rIFG. Gamma amplitude increases in preSMA precede those in rIFG. Zero ms is the time of the MS/NS cue and 1000 ms is the time of the go signal (indicated by the solid black line). The dotted line indicates mean RT. Z-scored amplitude is expressed in color. All results significant at p<0.05, FDR corrected are outlined (black indicates significance in positive direction, red indicates negative direction). Average amplitude for gamma (90–130 Hz) is shown plotted over time in the bottom row.
Figure 5
Figure 5
ECoG: Outright stopping for preSMA and rIFG. There are beta amplitude increases in both regions following the stop signal. Additionally, coherence between the two is greater for successful compared to unsuccessful stopping. Zero ms is the time of the stop signal (indicated by the solid black line). The dotted line indicated SSRT. For the top 2 rows, Z-scored amplitude is expressed in color. All results that are significant (p<0.01, uncorrected, for the conditions relative to baseline and p<0.05 uncorrected for the difference) are outlined (black indicates significance in positive direction, red indicates negative direction). For the bottom row Z-scored coherence values are expressed in color. All results that are significant (p<0.01, uncorrected) are outlined (black indicates significance in positive direction, red indicates negative direction).
Figure 6
Figure 6
ECoG: Outright stopping for the wider cortical network in the gamma band. Average high gamma (100 Hz) amplitudes (z-scored) are shown in color (red for increases relative to baseline, blue for decreases) for sequential 50 ms windows with 0 ms corresponding to the stop signal. Only values significant at p<0.01 FDR corrected are shown. Electrodes for which no data were available are indicated with a black circle.

References

    1. Akers D, Sherbondy A, Mackenzie R, Dougherty R, Wandell B. Exploring connectivity of the brain's white matter with dynamic queries. IEEE Trans Vis. Comput. Graph. 2005;11:419–430. - PubMed
    1. Aron AR. From reactive to proactive and selective control: developing a richer model for stopping inappropriate responses. Biol Psychiatry. 2010;69:e55–68. - PMC - PubMed
    1. Aron AR, Behrens TE, Smith S, Frank MJ, Poldrack RA. Triangulating a cognitive control network using diffusion-weighted magnetic resonance imaging (MRI) and functional MRI. J Neurosci. 2007;27:3743–3752. - PMC - PubMed
    1. Aron AR, Poldrack RA. Cortical and subcortical contributions to Stop signal response inhibition: role of the subthalamic nucleus. J Neurosci. 2006;26:2424–2433. - PMC - PubMed
    1. Beckmann CF, Jenkinson M, Smith SM. General multilevel linear modeling for group analysis in FMRI. Neuroimage. 2003;20:1052–1063. - PubMed

Publication types

MeSH terms