Comparative Study
. 2012 Apr;217(2):395-409.
doi: 10.1007/s00429-011-0351-8. Epub 2011 Oct 7.

Comparison of the effects of acute and chronic administration of ketamine on hippocampal oscillations: relevance for the NMDA receptor hypofunction model of schizophrenia

Affiliations
Comparative Study

Comparison of the effects of acute and chronic administration of ketamine on hippocampal oscillations: relevance for the NMDA receptor hypofunction model of schizophrenia

Kara Kittelberger et al. Brain Struct Funct. 2012 Apr.

Abstract

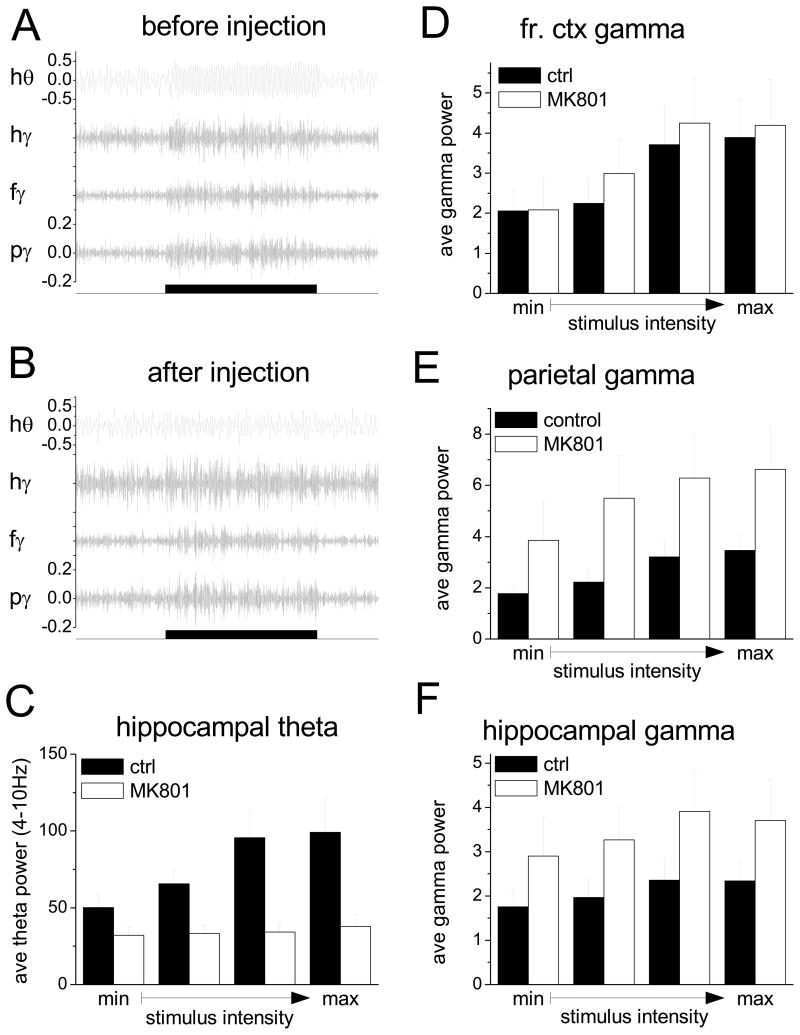
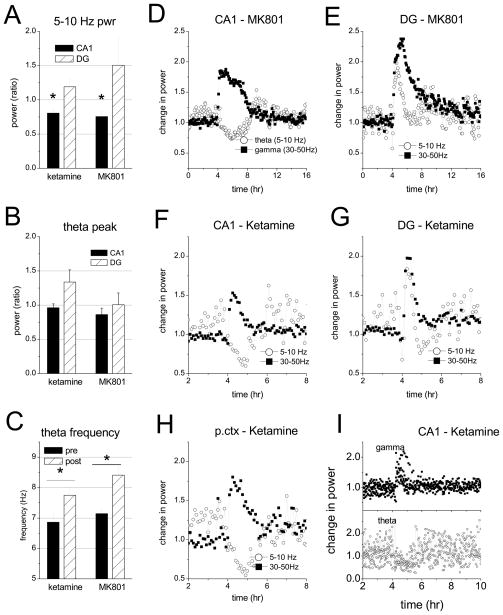
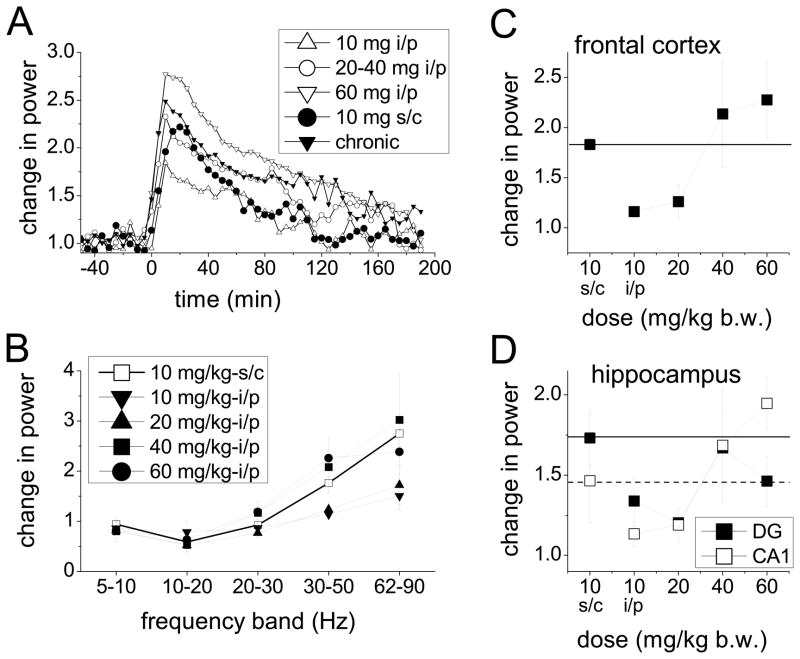
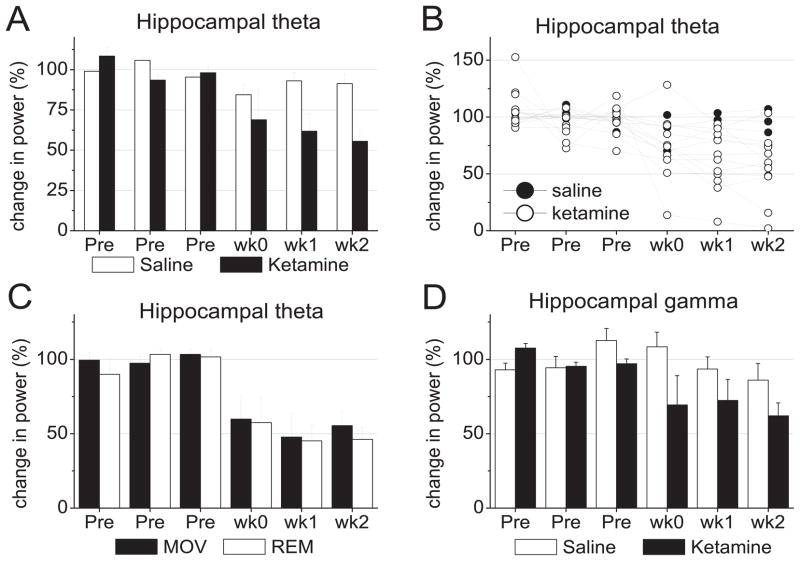
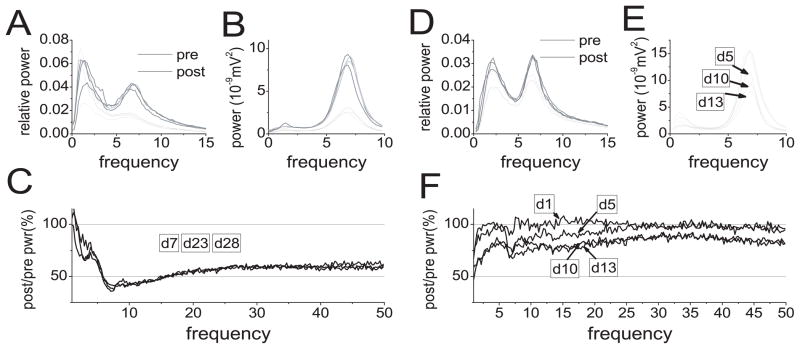
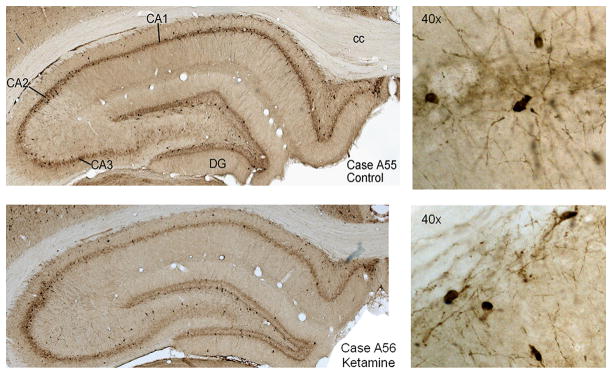
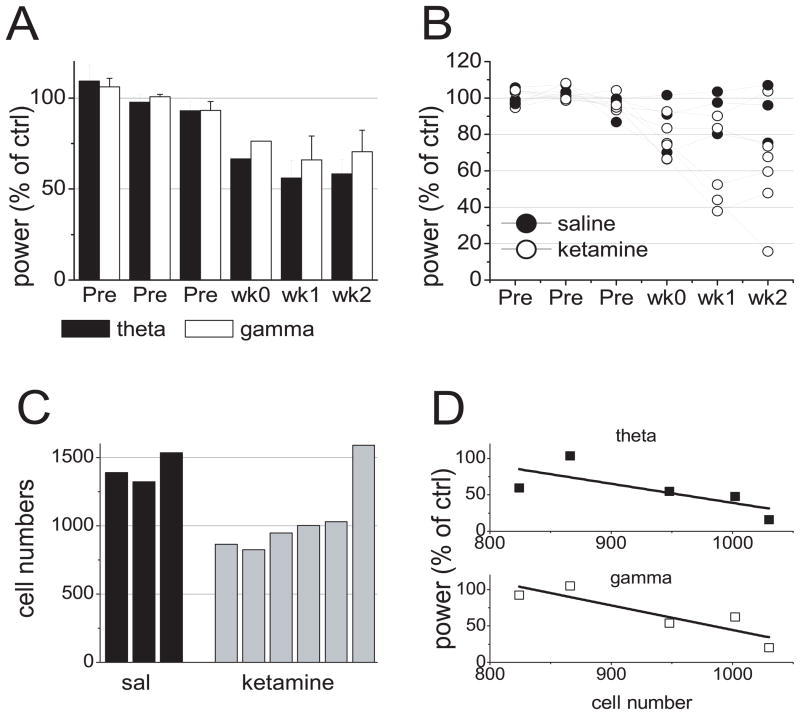
The proper organization and function of GABAergic interneuron networks is essential for many cognitive processes and abnormalities in these systems have been documented in schizophrenic patients. The memory function of the hippocampus depends on two major patterns of oscillations in the theta and gamma ranges, both requiring the intact functioning of the network of fast-firing interneurons expressing parvalbumin. We examined the ability of acute and chronic administration of NMDA receptor (NMDA-R) antagonists to recapitulate the oscillatory dysfunctions observed in schizophrenia. In freely moving rats, acute injection of MK801 or ketamine increased gamma power in both CA1 and dentate gyrus of the hippocampus. Theta peak shifted to higher frequencies whereas the average 5-10 Hz theta power decreased by 24% in CA1 and remained high in the dentate gyrus. Strong increase in CA1 gamma and decrease in theta power triggered by brainstem stimulation were found under urethane anesthesia. In contrast to acute experiments, chronic administration of ketamine caused a steady decline in both gamma and theta oscillations, 2-4 weeks after treatment. A further important difference between the two models was that the effects of acute injection were more robust than the changes after chronic treatment. Chronic administration of ketamine also leads to decrease in the number of detectable parvalbumin interneurons. Histological examination of interindividual differences indicated, however, that within the ketamine treated group a further decrease in parvalbumin neurons correlated with strengthening of oscillations. The findings are consistent with abnormalities of oscillations in human schizophrenia and further validate the NMDA-R hypofunction hypothesis.


Figures

Figure 1
Figure 1
Effect of NMDA-R antagonist on theta and gamma oscillations elicited in hippocampus and neocortex by stimulation of the brainstem reticular formation in urethane anesthetized rats. A and B. Specimen recording of hippocampal EEG filtered between 4–10 Hz (hθ) and 30–50 Hz (hγ) and of EEG (30–50 Hz) recorded over the frontal (fγ) and parietal (pγ) corticies before (A) and after (B) injection of MK801 (0.2 mg/kg, s/c) along with a time marker of stimulation (10 s). C. Average hippocampal theta power (4–10 Hz) elicited by electrical stimulation of the pontine reticular formation at current intensities increasing from threshold to maximum (see Methods) before (ctrl) and after (MK801) drug injection. D–F. Average gamma power (30–50 Hz) in frontal (D), and parietal (E) and in hippocampus (F) elicited by electrical stimulation of the pontine reticular formation. Segments included in analysis in C–F are from simultaneous recordings. Calibration scale: A–B: mV (same scale was used for all gamma traces); C–F: 100μV2.
Figure 2
Figure 2
Acute effect of NMDA antagonists on hippocampal theta and gamma oscillations in freely moving rats. Aand B. Changes in theta power (A: 5–10 Hz band and B: theta peak) after injection of ketamine and MK801 (averaged over 30 min and 2 hrs, respectively) relative to 30 min control recorded during wake motor activity. C. Peak theta frequency before and after injection. D–G. Time course of average theta (5–10 Hz) and gamma (30–50 Hz) power in the CA1 (n=9) and DG (n=4) areas of the hippocampus before and after injection of MK801 (0.2 mg/kg, s/c; n=9 and 4) and ketamine (10 mg/kg, s/c; n=6) in freely moving rats. Dots represent theta and gamma power averaged over 5 min segments, normalized using 1 hr averages in the beginning of the recording session. Note different time scales for MK801 and ketamine. H. Theta and gamma averages in parietal cortex (n=7). I. Traces of theta and gamma power in the CA1 region in individual experiments (n=6). Note large variation of theta before and 2 hours after ketamine injection.
Figure 3
Figure 3
Comparison of the acute effect of i/p and s/c ketamine injection in freely moving rats. A. Temporal dynamics of changes in gamma activity after i/p administration of ketamine in different doses (10, 20, 40, 60 mg/kg) and comparison with s/c injection. (“chronic” shows the acute effect of ketamine in chronic experiments). Average spectral power in the 30–50 Hz frequency range was calculated in 5 min windows. B. Effect of i/p and s/c ketamine on spectral power in different frequency bands. Power averaged over the first 45 min after injection is expressed relative to 45 min control segment before injection. C and D. Dose-response effect of i/p ketamine on gamma power in frontal cortex (C) and hippocampus (D) and comparison with the effect of s/c injection (gamma calculated as in B).
Figure 4
Figure 4
Effect of chronic treatment with subanesthetic doses of ketamine on hippocampal oscillations. A. Group averages of hippocampal theta power in a total of six recording sessions during the week before (Pre) and during a 2 week period after a 5 day course of daily injection of ketamine or saline (wk0: day 2–3, wk1: day 5–7, wk2: day 14–15 after the end of treatment). Power was normalized and expressed as percent of the average of the three pre-treatment recordings. B. Changes in hippocampal theta power in individual experiments. C. Changes in hippocampal theta power during theta states associated with waking exploration (MOV) and REM sleep (REM). D. Percent change in gamma (30–50 Hz) power in hippocampal EEG.
Figure 5
Figure 5
Patterns of the change in autospectra of hippocampal EEG after chronic treatment with ketamine in two rats (A–C and D–F). A and D. Relative power in the 0–15 Hz frequency range before (pre) and after (post) ketamine treatment calculated over 5 hours of continuous recording. B and E. Average autospectra of all theta episodes of hippocampal EEG during each 5 hr recording session. Note drop in theta power after ketamine treatment in the first rat (B) with no further change during the next 4 weeks and progressive decline in theta rhythm in the second rat (B) from day 5 (d5) to day 13 (d13) after the last day of treatment and. C and F. Change in spectral power in the 1–50 Hz range. Note 40–50 % decrease in gamma in the first experiment (C) and minor change in the second (F).
Figure 6
Figure 6
Differences in hippocampal parvalbumin positive interneurons in control (saline) and ketamine treated rats. Upper panels (Case A55) show a representative hippocampal section with darkly stained cell bodies and neuropil of a saline treated rat, lower panels show an example of katemine treated rat (Case A56). A higher magnification photo is shown on the right. Note fewer PV positive cell bodies in CA1 of A56 compared with A55.
Figure 7
Figure 7
Comparison of loss of PV+ cells in the hippocampus and decrease in theta and gamma power. A. Group averages of hippocampal CA1 theta and gamma power before (Pre) and after chronic ketamine treatment in 6 rats. B. Changes in hippocampal CA1 theta power in individual experiments treated with saline (n=3) or ketamine (n=6). C. Number of detectable PV+ cells in the CA1 area of the hippocampus of the same group of rats. D. Scatter plot of theta (top) and gamma power (bottom) 2 weeks after ketamine treatment, expressed as percent of pre-injection average, vs. PV+ cell number, in 5 rats which showed loss of PV+ cells.

References

    1. Adler CM, Malhotra AK, Elman I, Goldberg T, Egan M, Pickar D, Breier A. Comparison of ketamine-induced thought disorder in healthy volunteers and thought disorder in schizophrenia. Am J Psychiatry. 1999;156:1646–1649. - PubMed
    1. Baldeweg T, Spence S, Hirsch SR, Gruzelier J. Gamma-band electroencephalographic oscillations in a patient with somatic hallucinations. Lancet. 1998;352:620–621. - PubMed
    1. Becker A, Grecksch G. Ketamine-induced changes in rat behaviour: a possible animal model of schizophrenia. Test of predictive validity. Progress in Neuro-Psychopharmacology and Biological Psychiatry. 2004;28:1267–1277. - PubMed
    1. Becker A, Peters B, Schroeder H, Mann T, Huether G, Grecksch G. Ketamine-induced changes in rat behaviour: A possible animal model of schizophrenia. Progress in Neuro-Psychopharmacology and Biological Psychiatry. 2003;27:687–700. - PubMed
    1. Benes FM, Kwok EW, Vincent SL, Todtenkopf MS. A reduction of nonpyramidal cells in sector CA2 of schizophrenics and manic depressives. Biol Psychiatry. 1998;44:88–97. - PubMed

Publication types

MeSH terms