. 2011 Dec 2;286(48):41425-41433.
doi: 10.1074/jbc.M111.270843. Epub 2011 Oct 6.

Nucleophosmin interacts with FOXM1 and modulates the level and localization of FOXM1 in human cancer cells

Affiliations

Nucleophosmin interacts with FOXM1 and modulates the level and localization of FOXM1 in human cancer cells

Uppoor G Bhat et al. J Biol Chem. .

Abstract

Using mass spectrometric analysis we found that oncogenic transcription factor FOXM1 that is overexpressed in a majority of human cancers interacts with multifunctional protein NPM, which is also overexpressed in a variety of human tumors. Coimmunoprecipitation and glutathione S-transferase pull-down experiments demonstrated that NPM forms a complex with FOXM1 and also identified the regions responsible for their interaction. Immunofluorescence microscopy confirmed the interaction between FOXM1 and NPM in cancer and immortal cells. Furthermore, knockdown of NPM in immortal and cancer cells led to significant down-regulation of FOXM1 similar to its levels in normal cells, suggesting that NPM might modulate FOXM1 level. In addition, in OCI/AML3 leukemia cells where mutant NPM is localized in the cytoplasm we found that typically nuclear FOXM1 was predominantly co-localized with NPM in the cytoplasm, while NPM knockdown led to the disappearance of FOXM1 from the cytoplasm, suggesting that NPM may also determine intracellular localization of FOXM1. Knockdown of FOXM1 or NPM in MIA PaCa-2 pancreatic cancer cells inhibited anchorage-dependent and independent growth in cell culture, and tumor growth in nude mice. In addition, over-expression of FOXM1 reversed the effect of NPM knockdown in vitro. Our data suggest that in cancer cells NPM interacts with FOXM1 and their interaction is required for sustaining the level and localization of FOXM1. Targeting the interaction between FOXM1 and NPM by peptides or small molecules may represent a novel therapeutic strategy against cancer.


Figures

FIGURE 1.
FIGURE 1.
FOXM1 interacts with NPM in different human cancer cell lines. A, U2OS-FOXM1 cells were treated with 10 μm thiostrepton, lysed, immunoprecipitated with NPM antibody or control mouse IgG and immunoblotted for FOXM1 and NPM. B, mid-log MIA PaCa-2 cells were lysed, immunoprecipitated with NPM or FOXM1 specific antibodies or mouse/rabbit IgG (as controls), and immunoblotted for NPM and FOXM1. C, T7-tagged full-length (1–748) and truncated (1–688 and 1–195) FOXM1 constructs were transiently transfected into MIA PaCa-2 cells for 48 h. Cell lysates were pulled down by GST-NPM (FL)-Sepharose beads, separated by SDS-PAGE and blotted with T7 specific antibody. D, full-length T7-FOXM1 plasmid was transiently transfected into MIA PaCa-2 cells for 48 h. Cell lysates were pulled down with full-length and truncated GST-NPM-Sepharose beads, separated by SDS-PAGE and immunoblotted with T7-specific antibody. E, schematic of the domain structure of full-length and various deletion mutant GST-NPM constructs. HoD: homodimerization domain; NLS: nuclear localization signal; HeD: heterodimerization domain; NBD: nucleic acid binding domain. F, schematic of the domain structure of full-length and different truncated deletion mutant T7-tagged FOXM1 constructs. DBD: DNA binding domain; TAD: transactivation domain.
FIGURE 2.
FIGURE 2.
NPM knockdown leads to down-regulation of FOXM1. A, U2OS-C3 cells were transfected with either pLKO1 (control) or NPM shRNA constructs #68–72. 48 h after transfection, cells were lysed and immunoblotted for FOXM1 and NPM. β-actin was used as the loading control. B, protein levels of FOXM1 and NPM following transient NPM knockdown by lentiviral transduction in MCF7 human breast cancer cell line were determined by immunoblotting. β-Actin was used as the loading control. C, graphs show mean values ± S.E. of three independent experiments. D, protein levels of FOXM1 and NPM following transient NPM knockdown by lentiviral transduction in MIA PaCa-2 human pancreatic cancer cell line was determined by immunoblotting. β-Actin was used as the loading control. E, graphs show mean values ± S.E. of three independent experiments.
FIGURE 3.
FIGURE 3.
FOXM1 and NPM show co-localization in the nucleus in immortal and cancer, but not in normal cells. A, BJ wild type, immortal and transient NPM knockdown human foreskin fibroblast cells were seeded on coverslips in 6-well plates and immunostained for FOXM1 and NPM. The confocal images were subjected to deconvolution and then merged. FOXM1 (green) and NPM (red) co-localized (yellow) in the nuclei. Nuclei were counterstained with DAPI (blue). B, MIA PaCa-2, MCF7, and MCF7 NPM knockdown cells were seeded on coverslips in 6-well plates and immunostained for FOXM1 and NPM. The confocal images were subjected to deconvolution and then merged. FOXM1 (green) and NPM (red) co-localized (yellow) in the nuclei. Nuclei were counterstained with DAPI (blue). Scale bar represents 10 μm.
FIGURE 4.
FIGURE 4.
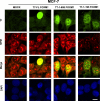
Co-localization of FOXM1 full-length and truncated mutant constructs with NPM. MCF7 breast cancer cells were transiently transfected with T7-tagged full-length and truncated (1–688 and 1–195) FOXM1 constructs. 48 h following transfection immunostaining was performed for T7 and NPM. The confocal images were subjected to deconvolution and then merged. T7 (green) and NPM (red) co-localized (yellow) in the nuclei. Nuclei were counterstained with DAPI (blue). Scale bar represents 10 μm.
FIGURE 5.
FIGURE 5.
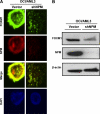
FOXM1 co-localizes with mutant NPM in the cytoplasm of human cancer cells. A, following transient NPM knockdown by lentiviral transduction in NPM mutant OCI/AML3 human leukemia cells immunostaining was carried out for FOXM1 and NPM. The confocal images were subjected to deconvolution and then merged. FOXM1 (green) and NPM (red) co-localized (yellow) in the cytoplasm. Nuclei were counterstained with DAPI (blue). B, protein levels of FOXM1 and NPM following transient NPM knockdown by lentiviral transduction in OCI/AML3 NPM mutant human leukemia cell line were determined by immunoblotting. β-Actin was used as the loading control.
FIGURE 6.
FIGURE 6.
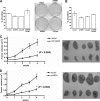
FOXM1 or NPM knockdown inhibits tumorigenesis in vitro and in vivo. A, for the anchorage-dependent growth assay, FOXM1 and NPM were transiently knocked down, and also FOXM1 was transiently overexpressed in MIA PaCa-2 pancreatic cancer cells and 48 h after transfection 2 × 10³ cells were plated in duplicate. Cells were stained with crystal violet after 10 days. Graph shows quantification of a representative experiment done in duplicate and representative plates are shown. B, for the anchorage-independent growth assay, FOXM1 and NPM were transiently knocked down, and also FOXM1 was transiently overexpressed in MIA PaCa-2 pancreatic cancer cells and 48 h after transfection 1.5 × 10⁴ cells per well were plated on soft-agar plates in triplicate. Colonies were counted after 15 days. Graph shows the quantification of a representative experiment done in triplicate. C, MIA PaCa-2 pancreatic cells with stable FOXM1 knockdown and the corresponding vector control cells (1 × 10⁶) were injected subcutaneously into the flank region on both sides of 4-week-old male nude mice. Tumor size was recorded weekly by caliper measurement. Graph demonstrates differences in rates of tumor growth over the study period. Representative picture of the excised tumors is shown. D, MIA PaCa-2 pancreatic cells with stable NPM knockdown and the corresponding vector control cells (1 × 10⁶) were injected subcutaneously into the flank region on both sides of 4-week-old male nude mice. Tumor size was recorded weekly by caliper measurement. Graph demonstrates differences in rates of tumor growth over the study period. Representative picture of the excised tumors is shown.

References

    1. Myatt S. S., Lam E. W. (2007) Nat. Rev. Cancer 7, 847–859 - PubMed
    1. Laoukili J., Stahl M., Medema R. H. (2007) Biochim. Biophys. Acta 1775, 92–102 - PubMed
    1. Ye H., Kelly T. F., Samadani U., Lim L., Rubio S., Overdier D. G., Roebuck K. A., Costa R. H. (1997) Mol. Cell. Biol. 17, 1626–1641 - PMC - PubMed
    1. Ye H., Holterman A. X., Yoo K. W., Franks R. R., Costa R. H. (1999) Mol. Cell. Biol. 19, 8570–8580 - PMC - PubMed
    1. Korver W., Roose J., Clevers H. (1997) Nucleic Acids Res. 25, 1715–1719 - PMC - PubMed

Publication types

MeSH terms

LinkOut - more resources