

Descriptive epidemiology of CNS tumors in France: results from the Gironde Registry for the period 2000-2007
- PMID: 21980160
- PMCID: PMC3223087
- DOI: 10.1093/neuonc/nor120
Descriptive epidemiology of CNS tumors in France: results from the Gironde Registry for the period 2000-2007
Abstract
An increase in the incidence of CNS tumors has been observed in many countries in the last decades. The reality of this trend has been much debated, as it has happened during a period when computer-assisted tomography and MRI have dramatically improved the detection of these tumors. The Gironde CNS Tumor Registry provides here the first data on CNS tumor incidence and trends in France for all histological types, including benign and malignant tumors, for the period 2000-2007. Incidence rates were calculated globally and for each histological subtype. For trends, a piecewise log-linear model was used. The overall annual incidence rate was found to be 17.6/100 000. Of this rate, 7.9/100 000 were neuroepithelial tumors and 6.0/100 000 were meningiomas. An overall increase in CNS tumor incidence was observed from 2000 to 2007, with an annual percent change (APC) of +2.33%, which was explained mainly by an increase in the incidence of meningiomas over the 8-year period (APC = +5.4%), and also more recently by an increase in neuroepithelial tumors (APC = +7.45% from 2003). The overall increase was more pronounced in women and in the elderly, with an APC peaking at +24.65% in subjects 85 and over. The increase in the incidence rates we observed may have several explanations: not only improvements in registration, diagnosis, and clinical practice, but also changes in potential risk factors.
Figures
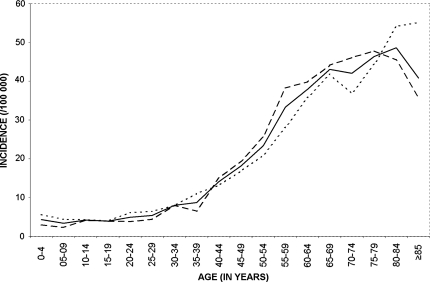
 Men
Men  Women
Women  Total.
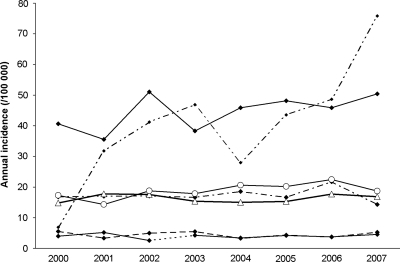
 Neuroepithelial tumors,
  meningeal tumors,
  cranial and spinal nerve tumors,
  lymphomas,
  others (local extension from regional tumors, craniopharyngiomas, germ cell tumors and cysts, unclassified tumors.
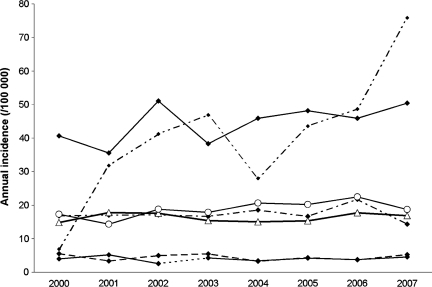
 0–14 y
  25–64 y
  15–24
15–24  65–84 y
  ≥ 85 y.
  Women
Women  Men.
Men.References
-
- Deltour I, Johansen C, Auvinen A, Feychting M, Klaeboe L, Schüz J. Time trends in brain tumour incidence rates in Denmark, Finland, Norway, and Sweden, 1974–2003. J Natl Cancer Inst. 2009;101:1721–1724. - PubMed
-
- Christensen HC, Kosteljanetz M, Johansen C. Incidences of gliomas and meningiomas in Denmark, 1943 to 1997. Neurosurgery. 2003;52:1327–1333. - PubMed
-
- Helseth A. The incidence of primary central nervous system neoplasms before and after computerized tomography availability. J Neurosurg. 1995;83:999–1003. - PubMed
-
- Hess KR, Broglio KR, Bondy ML. Adult glioma incidence trends in the United States, 1977–2000. Cancer. 2004;101:2293–2299. - PubMed
Publication types
MeSH terms
LinkOut - more resources
Full Text Sources
Medical
