. 2011 Sep;7(9):e1002205.
doi: 10.1371/journal.pcbi.1002205. Epub 2011 Sep 29.

Determinants of the spatiotemporal dynamics of the 2009 H1N1 pandemic in Europe: implications for real-time modelling

Affiliations

Determinants of the spatiotemporal dynamics of the 2009 H1N1 pandemic in Europe: implications for real-time modelling

Stefano Merler et al. PLoS Comput Biol. 2011 Sep.

Abstract

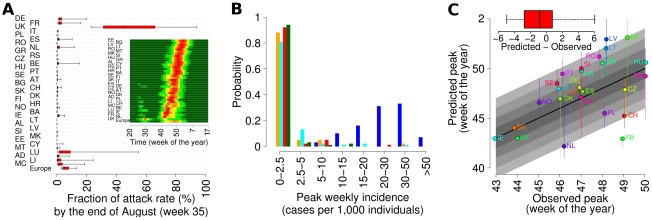
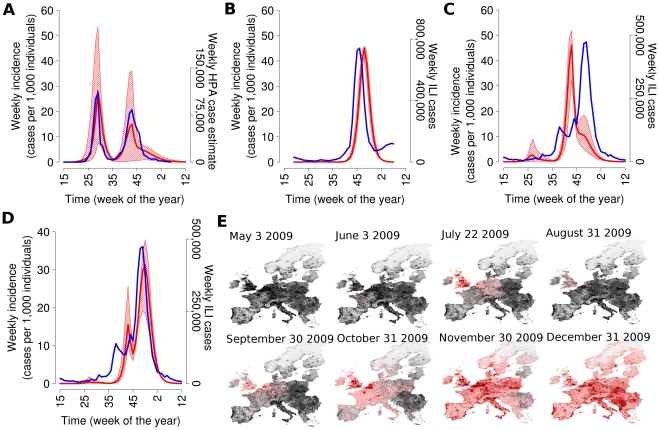
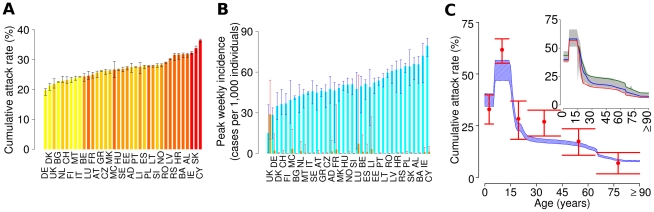
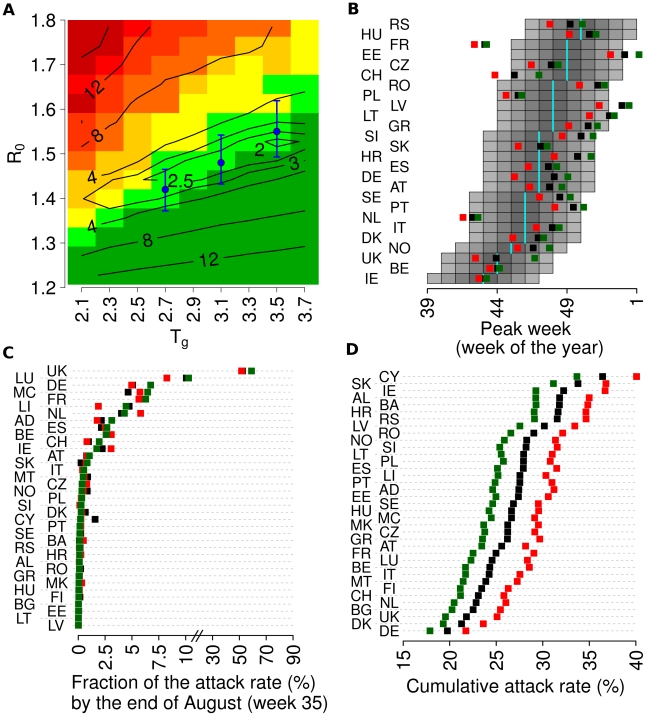
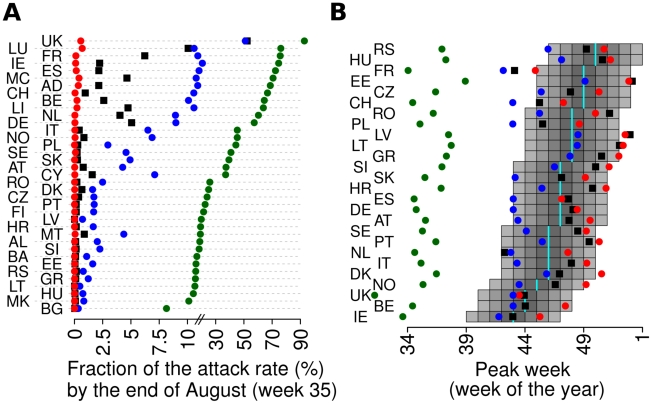
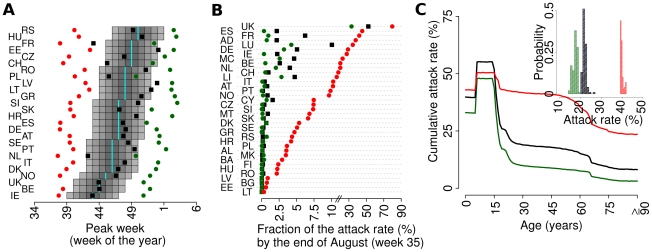
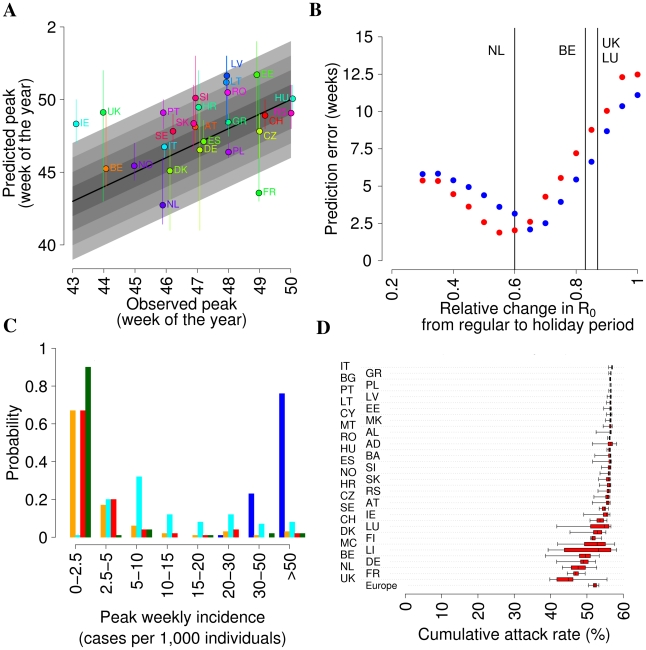
Influenza pandemics in the last century were characterized by successive waves and differences in impact and timing between different regions, for reasons not clearly understood. The 2009 H1N1 pandemic showed rapid global spread, but with substantial heterogeneity in timing within each hemisphere. Even within Europe substantial variation was observed, with the UK being unique in experiencing a major first wave of transmission in early summer and all other countries having a single major epidemic in the autumn/winter, with a West to East pattern of spread. Here we show that a microsimulation model, parameterised using data about H1N1pdm collected by the beginning of June 2009, explains the occurrence of two waves in UK and a single wave in the rest of Europe as a consequence of timing of H1N1pdm spread, fluxes of travels from US and Mexico, and timing of school vacations. The model provides a description of pandemic spread through Europe, depending on intra-European mobility patterns and socio-demographic structure of the European populations, which is in broad agreement with observed timing of the pandemic in different countries. Attack rates are predicted to depend on the socio-demographic structure, with age dependent attack rates broadly agreeing with available serological data. Results suggest that the observed heterogeneity can be partly explained by the between country differences in Europe: marked differences in school calendars, mobility patterns and sociodemographic structures. Moreover, higher susceptibility of children to infection played a key role in determining the epidemiology of the 2009 pandemic. Our work shows that it would have been possible to obtain a broad-brush prediction of timing of the European pandemic well before the autumn of 2009, much more difficult to achieve with simpler models or pre-pandemic parameterisation. This supports the use of models accounting for the structure of complex modern societies for giving insight to policy makers.


Conflict of interest statement

The authors have declared that no competing interests exist.

Figures

Figure 1
Figure 1. Timing of the pandemic (R0 UK = 1.48 Tg = 3.1 days).
(A) Distribution of the fraction of predicted attack rate (2.5%, 25%, 50%, 75% and 97.5% percentiles) by the end of August (week 35) in the different countries. In the inset, mean incidence per week in the different European countries in colour scale, from dark green (less than 5 per 1,000) to dark red (above 50 per 1,000). (B) Probability of observing a summer wave with peak incidence in a given range, in UK (blue), Germany (cyan), Netherlands (orange), Ireland (green) and Spain (red). (C) Observed peak week plotted versus predicted peak week (vertical bars represent 95% confidence intervals of the predictions) for European countries covered by the WHO/Europe weekly influenza surveillance system; only the autumn wave is considered for UK. In the inset minimum, 25%, 50%, 75% percentiles and maximum of observed minus predicted peak week. A total of 100 simulations were undertaken to produce the results shown.
Figure 2
Figure 2. Spatiotemporal spread of the European pandemic (R0 UK = 1.48 Tg = 3.1 days).
(A) Comparison between average weekly incidence in UK as predicted by the model (red) and weekly HPA case estimates (blue). Red shaded area represents 95% confidence intervals of the expected weekly incidence over time. (B) Comparison between average weekly incidence in Italy as predicted by the model (red) and weekly ILI cases (blue). (C) Comparison between average weekly incidence in France as predicted by the model (red) and weekly ILI cases (blue). (D) As (C) but assuming R0 UK = 1.43. (E) Time sequence (in days) of a single simulation with the first European case in UK is shown. Colours from pink to dark red indicate an increasing number of daily cases (dark red indicates more than 10,000 daily cases). A total of 100 simulations were undertaken to produce the results shown.
Figure 3
Figure 3. Variation in attack rates by age and country (R0 UK = 1.48 Tg = 3.1 days).
(A) Average cumulative attack rate predicted by the model in the different European countries (black bars represent 2.5% and 97.5% percentiles of the distribution). Colours represent the fraction of individuals <15 year old in the population, increasing from yellow (13%) to red (22%). (B) Average peak weekly incidences predicted by the model in the different countries for the summer (orange) and the autumn (cyan) waves; for each country and wave, 2.5% and 97.5% percentiles of the distribution are shown (red and blue bars). (C) Post pandemic age-stratified attack rates. Estimates of post pandemic seroconvertion rates in England (precisely, differences between the percentage of post pandemic (2010) serum samples from England with HI 1∶32 or more, and corresponding percentages in serum samples obtained in 2008 in England) against cumulative attack rates by age in UK predicted by the model at the end of the pandemic: red points represent the expected value of post pandemic seroconversion rates (vertical lines represent 95% confidence intervals), shaded blue areas represent 95% confidence intervals of model simulations. Cumulative attack rates by age as predicted by the model at the end of epidemic in different European countries are shown in the inset: shaded grey area represent 95% confidence interval at European level, while solid lines represent the median for Italy (blue), Germany (red) and Ireland (green). A total of 100 simulations were undertaken to produce the results shown.
Figure 4
Figure 4. Sensitivity to assumed R 0 and T g.
(A) Sensitivity analysis by varying R0 UK and Tg: level curves (and numbers) in black represent the mean deviation between observed and predicted peek week (in weeks). Colours represent the expected number N of countries with peak of the summer wave above 30 per 1000 individuals, ranging from dark green (N = 0) to dark red (N>30). Light green indicates 0.5<N< = 1.5, yellow indicates 1.5<N< = 2.5 and light orange indicate 2.5<N< = 5. Blue points represent possible pairs (R0 UK, Tg) as resulting from the Qsurveillance data: R0 UK = 1.42, Tg = 2.7 days; R0 UK = 1.48, Tg = 3.1 days; R0 UK = 1.55, Tg = 3.5 days. Blue vertical lines represent the uncertainty of R0 UK as resulting from the uncertainty of the growth rate r of the Qsurveillance data. (B) Peak week for European countries covered by the WHO/Europe weekly influenza surveillance system as observed (cyan bars), as predicted by simulations with R0 UK = 1.48 and Tg = 3.1 days (black squares), as predicted by simulations with R0 UK = 1.42 and Tg = 2.7 days (green squares) and as predicted by simulations with R0 UK = 1.55 and Tg = 3.5 days (red squares). (C) As (B) but for the fraction of the attack rate by end of August. (D) As (B) but for the cumulative attack rate. A total of 100 simulations were undertaken for each parameter set to produce the results shown.
Figure 5
Figure 5. Effects of school holidays (R0 UK = 1.48 Tg = 3.1 days).
(A) Fraction of all infections expected by end of August (week 35) as predicted by baseline simulations (actual school calendars in all countries, including autumn holidays, black squares), by assuming no holidays (green circles), by assuming the school calendar of Finland in all countries (schools close on 30 May, red circles) and by assuming the school calendar of UK in all countries (schools close on 20 July, blue circles). (B) Peak week for European countries covered by the WHO/Europe weekly influenza surveillance system as observed (cyan bars), as predicted by baseline simulations (black squares), by assuming no holidays (green circles), by assuming the school calendar of Finland in all countries (red circles) and by assuming the school calendar of UK in all countries (blue circles). A total of 100 simulations for each parameter set were undertaken to produce the results shown.
Figure 6
Figure 6. Effects of age-dependent susceptibility to infection (R0 UK = 1.48 Tg = 3.1 days).
(A) Peak week for European countries covered by the WHO/Europe weekly influenza surveillance system as observed (cyan bars), as predicted by baseline simulations (susceptibility of children 2 fold greater than that of adults, black), by assuming that susceptibility of children and adults was identical (red) and by assuming children were 4-fold more susceptible than adults (green). (B) As (A) but showing the fraction of the attack rate by end of August. (C) As (A) but showing mean cumulative attack rates by age in UK. The inset shows the distribution across simulations of the cumulative attack rates in UK in the three scenarios. A total of 100 simulations for each parameter set were undertaken to produce the results shown.
Figure 7
Figure 7. Predictions of simpler models (R0 = 1.48 Tg = 3.1 days).
(A) Observed peak week plotted versus predicted peak week (predictions refer to the best model with coupling between European countries: R 0 = 0.8 during holidays; vertical bars represent 95% confidence intervals of the predictions) for European countries covered by the WHO/Europe weekly influenza surveillance system; only the Autumn wave is considered for UK. (B) Prediction error (average of the absolute value of predicted minus observed peak week in European countries covered by the WHO/Europe weekly influenza surveillance system) as a function of the relative change of R0 during the summer for models with (red points) and without (blue points) coupling between European countries (i.e. long-distance travel). Vertical lines corresponds to the relative change of R 0 during holidays in four European countries as resulting from the analysis of the POLYMOD data . (C) Probability of observing a summer wave with peak incidence in a given range (predictions refer to the best model with coupling between European countries: R 0 = 0.8 during holidays), in UK (blue), Germany (cyan), Netherlands (orange), Ireland (green) and Spain (red). (D) Cumulative attack rate (2.5%, 25%, 50%, 75% and 97.5% percentiles of the distribution are shown) in the different European countries (predictions refer to the best model with coupling between European countries: R0 = 0.8 during holidays). A total of 100 simulations for each parameter set were undertaken to produce the results shown.

Similar articles

Cited by

References

    1. Khan K, Arino J, Hu W, Raposo P, Sears J, et al. Spread of a Novel Influenza A (H1N1) Virus via Global Airline Transportation. N Engl J Med. 2009;361:212–214. - PubMed
    1. Poggensee G, Gilsdorf A, Buda S, Eckmanns T, Claus H, et al. The first wave of pandemic influenza (H1N1) 2009 in Germany: from initiation to acceleration. BMC Infect Dis. 2010;10:155. - PMC - PubMed
    1. Hahné S, Donker T, Meijer A, Timen A, van Steenbergen J et al. Epidemiology and control of influenza A(H1N1)v in the Netherlands: the first 115 cases. Euro Surveill. 2009;14::pii = 19267. - PubMed
    1. Gilsdorf A, Poggensee G Working Group Pandemic Influenza A(H1N1)v. Influenza A(H1N1)v in Germany: the first 10,000 cases. Euro Surveill. 2009;14:pii = 19318. - PubMed
    1. Belgian working group on influenza A(H1N1)v. Influenza A(H1N1)v virus infections in Belgium. Euro Surveill. 2009;14:pii = 19270. - PubMed

Publication types