. 2011 Sep;7(9):e1002251.
doi: 10.1371/journal.ppat.1002251. Epub 2011 Sep 29.

High-resolution phenotypic profiling defines genes essential for mycobacterial growth and cholesterol catabolism

Affiliations

High-resolution phenotypic profiling defines genes essential for mycobacterial growth and cholesterol catabolism

Jennifer E Griffin et al. PLoS Pathog. 2011 Sep.

Abstract

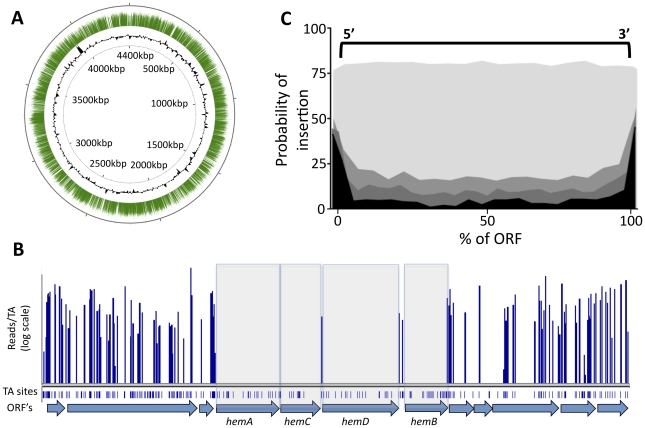
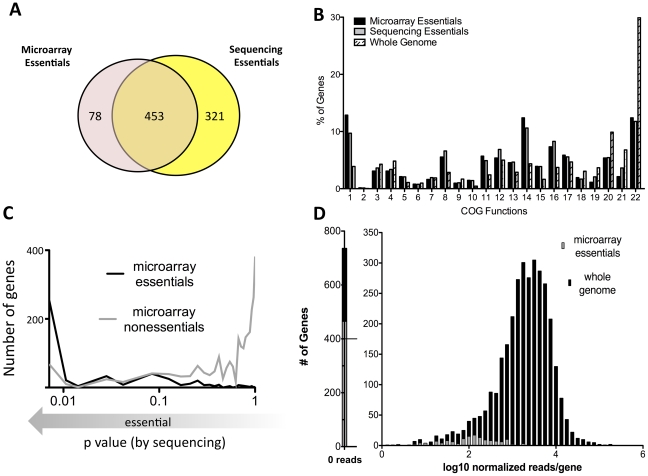
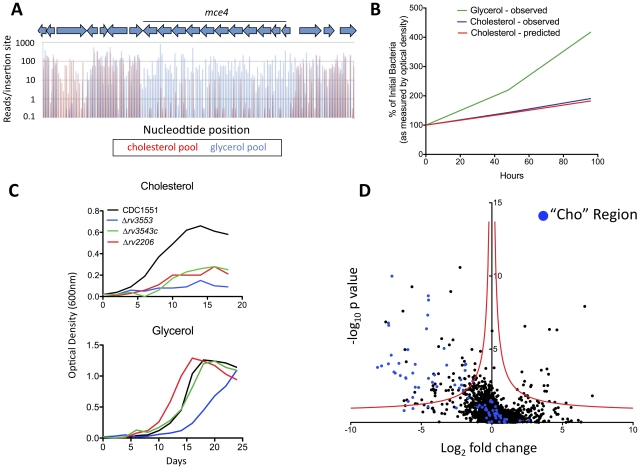
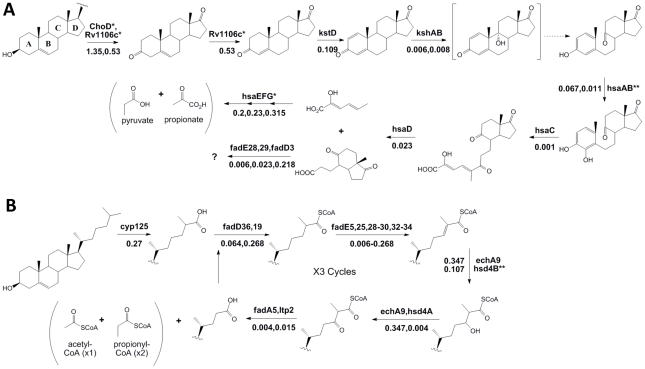
The pathways that comprise cellular metabolism are highly interconnected, and alterations in individual enzymes can have far-reaching effects. As a result, global profiling methods that measure gene expression are of limited value in predicting how the loss of an individual function will affect the cell. In this work, we employed a new method of global phenotypic profiling to directly define the genes required for the growth of Mycobacterium tuberculosis. A combination of high-density mutagenesis and deep-sequencing was used to characterize the composition of complex mutant libraries exposed to different conditions. This allowed the unambiguous identification of the genes that are essential for Mtb to grow in vitro, and proved to be a significant improvement over previous approaches. To further explore functions that are required for persistence in the host, we defined the pathways necessary for the utilization of cholesterol, a critical carbon source during infection. Few of the genes we identified had previously been implicated in this adaptation by transcriptional profiling, and only a fraction were encoded in the chromosomal region known to encode sterol catabolic functions. These genes comprise an unexpectedly large percentage of those previously shown to be required for bacterial growth in mouse tissue. Thus, this single nutritional change accounts for a significant fraction of the adaption to the host. This work provides the most comprehensive genetic characterization of a sterol catabolic pathway to date, suggests putative roles for uncharacterized virulence genes, and precisely maps genes encoding potential drug targets.


Conflict of interest statement

The authors have declared that no competing interests exist.

Figures

Figure 1
Figure 1. Transposon insertions are randomly distributed, and gaps in transposon coverage correspond to predicted essential ORFs.
(A) Transposon:chromosome junctions from high density mutant libraries were identified by deep sequencing. The number of sequence reads corresponding to each insertion site is represented as green bars mapped onto the circular chromosome of M. tuberculosis H37Rv. Black contour represents the GC content of the chromosome (G+C content greater or less than 50% are represented as contours outside or inside the ring, respectively). Nucleotide positions are indicated (kilobases). (B) Essential heme biosynthetic genes are devoid of insertions. The number of sequence reads (“reads/TA”) is shown for the indicated region of the H37Rv chromosome. Potential TA dinucleotide insertions sites are indicated. (C) Each potential TA insertion site in the genome was assigned a position relative to the nearest ORF. The probability of detecting an insertion at each ORF position (per 20 TA window) is plotted on the y-axis. Genes predicted to be nonessential (p value >0.5, shaded lightest gray) show no position-dependent insertional bias. In contrast, genes predicted to be required for growth with different degrees of confidence (p<0.2, p<0.01, p<0.00005, indicated in progressively darker shading) show a strong bias against insertions in the open reading frame.
Figure 2
Figure 2. Defining essential genes with deep sequencing is more sensitive and precise than previous approaches.
(A) Gene sets predicted to be essential via microarray are compared with genes predicted to be essential via deep sequencing.(p<0.05) (B) Microarray and deep sequencing identify essential genes sets consisting of similar predicted functions, which differ from the genome as a whole. Clusters of Orthologous Groups (COG) categories associated with essential genes predicted by microarray or deep sequencing (p<0.05) are plotted along with the predictions for the entire genome. COG functions are: 1) Translation, ribosomal structure, biogenesis, 2) RNA processing, modification, 3) Transcription, 4) Replication, recombination, repair, 5) Cell cycle control, cell division, chromosome partitioning, 6) Defense mechanisms, 7) Signal transduction mechanisms, 8) Cell wall/membrane/envelope biogenesis, 9) Cell motility, 10) Intracellular trafficking, secretion, vesicular transport, 11) Posttranslational modification, protein turnover, chaperones, 12) Energy production, conversion, 13) Carbohydrate transport, metabolism, 14) Amino acid transport, metabolism, 15) Nucleotide transport, metabolism, 16) Coenzyme transport, metabolism, 17) Lipid transport, metabolism, 18) Inorganic ion transport, metabolism, 19) Secondary metabolites biosynthesis, transport, catabolism, 20) General function prediction only, 21) Function unknown, 22) No assignment. (C) Microarray predictions are generally, but not absolutely, consistent with deep sequencing. The probability of essentiality defined via deep sequencing is plotted on the x-axis (as log p value) for genes previously predicted by microarray to be either essential (black) or nonessential (gray). (D) Mutations in nonessential genes previously predicted to be required for growth cause quantitative fitness defects. Normalized sequence reads per gene (log scale) are plotted for all genes (black) and genes predicted to be essential by microarray (gray). Previously defined essential genes with detectable insertions are associated with low sequence read counts, suggesting quantitative underrepresentation in the library. Genes containing fewer than seven TA's were excluded from all analyses, since statistically-significant predictions could not be made.
Figure 3
Figure 3. Genes required for growth on cholesterol.
(A) Mce4 mutants are specifically underrepresented in the cholesterol-grown pool. Transposon libraries grown for 12 generations in media with either glycerol or cholesterol as a primary carbon source were compared by deep sequencing. Normalized sequence reads for individual insertions sites throughout the Mce4 operon are shown following growth in glycerol (blue) and cholesterol (red). The average underrepresentation of Mce4 mutants in the cholesterol-grown pool corresponds to a predicted 31% growth disadvantage per generation. (B) The number of sequence reads per TA provides an accurate estimate of relative growth rates. The experimentally determined growth curves of a Mce4 deletion mutant in the indicated media are compared to the growth rate of Mce4 mutants predicted in panel A. Log phase growth is plotted as percentage of initial bacterial number. (C) Mutants predicted to be required for cholesterol utilization display the predicted phenotypes. Transposon mutants were grown in minimal media with the indicated primary carbon sources and growth was monitored by optical density. This experiment was repeated three times with similar results. (D) Identification of genes that are differentially required for growth. For each gene, the ratio of normalized sequence reads per insertion site (cholesterol pool/glycerol pool) is plotted on the x-axis (“fold change”). Y-axis represents the significance of each of these changes in representation (p value). A hyperbolic function was used to define genes that were differentially represented. The asymptotes of these curves are 0 for the log2 fold change and −0.07 for the log10 p value. Genes containing fewer than two TA sites were excluded from the analysis. Genes in blue represent those within the predicted cholesterol region.
Figure 4
Figure 4. Phenotypic profiling predicts the cholesterol catabolic pathway.
Proposed chemical transformations necessary for cholesterol degradation are divided into sterol ring cleavage and opening (A) and side-chain degradation (B). Enzymes known to or predicted to function at each step are noted with their respective fold change (sequence reads in cholesterol/sequence reads in glycerol) below. Dotted lines represent spontaneous reactions. We did not find enzymes with marked * to be significantly required for growth on cholesterol. Enzymes marked with ** indicate those where we are unable to report significance due to insufficient data. The specific β-oxidation steps mediated by fadE28 and fadE29 are difficult to predict based on their homology to testosterone degrading enzymes and therefore, we have assigned them to both equally likely steps.

References

    1. World Health Organization. Global Tuberculosis Control: Surveillance P, Financing. WHO Report. 2010 http://www.who.int/tb/publications/global_report/2010/en/index.html.
    1. Russell DG, VanderVen BC, Lee W, Abramovitch RB, Kim MJ, et al. Mycobacterium tuberculosis wears what it eats. Cell Host Microbe. 2010;8:68–76. - PMC - PubMed
    1. Badarinarayana V, Estep PW, Shendure J, Edwards J, Tavazoie S, et al. Selection analyses of insertional mutants using subgenic-resolution arrays. Nat Biotechnol. 2001;19:1060–1065. - PubMed
    1. Rengarajan J, Bloom BR, Rubin EJ. Genome-wide requirements for Mycobacterium tuberculosis adaptation and survival in macrophages. Proc Natl Acad Sci U S A. 2005;102:8327–8332. - PMC - PubMed
    1. Sassetti CM, Boyd DH, Rubin EJ. Comprehensive identification of conditionally essential genes in mycobacteria. Proc Natl Acad Sci U S A. 2001;98:12712–12717. - PMC - PubMed

Publication types