. 2011 Sep;7(9):e1002295.
doi: 10.1371/journal.pgen.1002295. Epub 2011 Sep 29.

Genomic analysis of QTLs and genes altering natural variation in stochastic noise

Affiliations

Genomic analysis of QTLs and genes altering natural variation in stochastic noise

Jose M Jimenez-Gomez et al. PLoS Genet. 2011 Sep.

Abstract

Quantitative genetic analysis has long been used to study how natural variation of genotype can influence an organism's phenotype. While most studies have focused on genetic determinants of phenotypic average, it is rapidly becoming understood that stochastic noise is genetically determined. However, it is not known how many traits display genetic control of stochastic noise nor how broadly these stochastic loci are distributed within the genome. Understanding these questions is critical to our understanding of quantitative traits and how they relate to the underlying causal loci, especially since stochastic noise may be directly influenced by underlying changes in the wiring of regulatory networks. We identified QTLs controlling natural variation in stochastic noise of glucosinolates, plant defense metabolites, as well as QTLs for stochastic noise of related transcripts. These loci included stochastic noise QTLs unique for either transcript or metabolite variation. Validation of these loci showed that genetic polymorphism within the regulatory network alters stochastic noise independent of effects on corresponding average levels. We examined this phenomenon more globally, using transcriptomic datasets, and found that the Arabidopsis transcriptome exhibits significant, heritable differences in stochastic noise. Further analysis allowed us to identify QTLs that control genomic stochastic noise. Some genomic QTL were in common with those altering average transcript abundance, while others were unique to stochastic noise. Using a single isogenic population, we confirmed that natural variation at ELF3 alters stochastic noise in the circadian clock and metabolism. Since polymorphisms controlling stochastic noise in genomic phenotypes exist within wild germplasm for naturally selected phenotypes, this suggests that analysis of Arabidopsis evolution should account for genetic control of stochastic variance and average phenotypes. It remains to be determined if natural genetic variation controlling stochasticity is equally distributed across the genomes of other multi-cellular eukaryotes.


Conflict of interest statement

The authors have declared that no competing interests exist.

Figures

Figure 1
Figure 1. QTLs and known genes controlling per line CV in Glucosinolates.
(A) Shows the position of QTLs for 40 CV glucosinolate phenotypes. Random permutation threshold for significant enrichment of co-localized QTL is 2. The y-axis indicates the total number of phenotypes controlled by a given QTL. Labels show the position of known QTLs and the new MTB2976 QTL. The 392 line Bay x Sha RIL population was utilized to map QTL for this analysis and this has a smaller genetic map than the 211 RIL subset due to a lower marker density. Black circles below the x-axis show the position of QTLS found to control the average phenotype . GSL.ELF3 was previously described as GSL.ALIPH.II.42 . (B) The effect of single gene variation at GSL.AOP and GSL.MYB QTLs on the CV for aliphatic glucosinolates is presented as the ratio of the average aliphatic glucosinolate CV within the single gene variant to the parental WT Col-0. 28-1, 29-1 and 76-1 are homozygous insertional T-DNA mutants for MYB28, MYB29 and MYB76 respectively. The AOP2 genotype is the Arabidopsis Col-0 accession (contains a natural knockout in AOP2) expressing a functional AOP2 enzyme . Black boxes show those comparisons where the single gene variant was significantly different from WT (P<0.05, Levene's F-test comparing variance between mutant and WT genotypes). (C) The effect of single gene variation at GSL.AOP and GSL.MYB QTLs on the CV for indolic glucosinolates is presented as the ratio of the average aliphatic glucosinolate CV within the single gene variant to the parental WT Col-0. 28-1, 29-1 and 76-1 are homozygous insertional T-DNA mutants for MYB28, MYB29 and MYB76 respectively. The AOP2 genotype is the Arabidopsis Col-0 accession (contains a natural knockout in AOP2) expressing a functional AOP2 enzyme. Black boxes show those comparisons where the single gene variant was significantly different from WT (P<0.05, Levene's F-test comparing variance between mutant and WT genotypes).
Figure 2
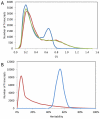
Figure 2. Summary of per transcript CV in Bay, Sha, and 211 RILs.
The average per transcript CV for 22,746 transcripts from Bay, Sha and across 211 Bay x Sha RILs was measured from two independent microarray experiments each containing independent biological replicates per genotype. (A) The distribution of CV across the transcripts is shown for Sha (yellow-green), Bay (red) and 211 Bay x Sha RILs (blue). For the RIL histogram, CV is averaged across all 211 RILs per transcript. The Bay and Sha distributions are significantly different (t-test, P<0.001). (B) The estimated heritability for per transcript CV between the Bay/Sha parents (Red) and within the 211 RILs (Blue).
Figure 3
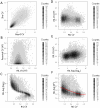
Figure 3. Relationship of transcript CV to heritability and average expression.
Heritability, average expression and CV for Bay, Sha and the RILs was measured for all 22,746 transcripts. Graphs are hexbin histograms with the counts per hex shown to the right of each graph. (A) Correlation of measured transcript CV in Bay and Sha. (B) Comparison of transcript CV heritability in the Parents and RILs. (C) Comparison of average transcript expression and average transcript CV within the RILs. (D) Comparison of transcript CV heritability and average transcript CV within the RILs. (E) Comparison of transcript CV heritability and average transcript abundance within the RILs.
Figure 4
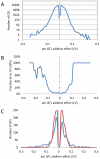
Figure 4. Distribution of additive effects of allele variation upon CV for significant CV eQTL.
The absence of values near 0 is likely due to statistical power that does not allow detection of these loci if they exist. Additive effect is defined as the estimated impact of the Sha allele. (A) The distribution of all CV eQTL additive effects is shown in a log scale to allow for better visualization of the tails. (B) The fraction of CV eQTL that are due to cis localized CV eQTL. (C) Comparison of additive effect between genes with a cis eQTL for just transcript CV (Red) and for both transcript CV and mean (Blue).
Figure 5
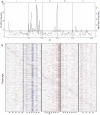
Figure 5. CV eQTL for Bay x Sha RIL population.
CV eQTLs were mapped for 21,974 out of 22,746 transcript CVs tested. (A) The solid line shows a 2.5 cM sliding window analysis of the average number of CV eQTL per region. Chromosomes are labeled at the top and cM per chromosome is at the bottom. The horizontal line represents the α = 0.05 threshold for regions with a significant enrichment in CV eQTL (1,000 random permutations). The dashed line shows an equivalent 2.5 cM sliding window analysis of the average number of mean eQTL per region using the same transcripts as a reference. (B) Heat map of CV eQTL for transcripts. Chromosomes are as labeled in A. The physical position of the genes from which the transcript are derived are ordered on the y-axis by their physical position with the first gene on chromosome I at the top and the last gene on chromosome V on the bottom. Red represents a negative effect of the Bay allele upon CV while blue is a positive effect. Genes are plotted in bins so the map positions do not exactly align with those in A.
Figure 6
Figure 6. Genetics of global transcript CV.
The average global transcript CV per RIL was taken by averaging across all 22,746 transcript CVs per RIL. The Bay and Sha parents global transcript CV are respectively 0.411 and 0.399 (P<0.05, ANOVA). Bay and Sha parental plants were grown with the RILs. (A) Histogram of global transcript CV across the 211 RILs. (B) The LOD plot for mapping QTL within the 211 RILs that control global transcript CV variation. (C) Additive effect plot for the QTL. The direction is based on the Sha allele.
Figure 7
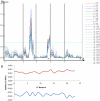
Figure 7. CT phase group CV QTL for circadian clock outputs.
All transcripts previously identified as being regulated by the circadian clock were grouped into 24 different CT phase groups based upon the transcripts time of peak expression (CT) during the 24 hour photoperiod –. For instance, a transcript that peaks at CT 0 is binned within the CT0 phase group. All individual transcripts values within a CT phase group were then Z normalized and the average across all transcripts per CT phase group was obtained to derive a single expression estimate for each CT phase group for each microarray. These were then used to estimate the variance of the CT phase groups expression as described. (A) LOD plot for the 23 CT phase groups. (B) The additive effect of the Sha allele (y-axis) at the putative ELF3 CV QTL (Blue) and the Chromosome III QTL located between At3g58680 and At3g61100 (Red) is shown across all 24 CT phase groups (x-axis).
Figure 8
Figure 8. ELF3 alters phenotypic CV.
(A) Average coefficient of variance for the elf3-1:ELF3Bay and elf3-1:ELF3Sha T1 transgenic plants from 10 experiments performed in either constant red or red plus far red light. The mean coefficients of variance are statistically different between the alleles with a p = 0.0019 via ANOVA. Results were also significant by Levene's F-test. (B) Coefficient of variance for flowering time in the elf3-1:ELF3Bay and elf3-1:ELF3Sha T1 transgenic plants from 10 experiments performed in either constant red or red plus far red light. Significance by Levene's F-test is shown. (C) Coefficient of variance for the time to bolting in elf3-1:ELF3Bay and elf3-1:ELF3Sha T1 transgenic plants from 10 experiments performed in either constant red or red plus far red light. Significance by Levene's F-test is shown. (D) Coefficient of variance in 4-methylsulfinylbutyl (4-MSOB) and 7-methylsulfinylheptyl (7-MSOH) glucosinolate in elf3-1:ELF3Bay and elf3-1:ELF3Sha T1 transgenic plants from 9experiments. Significance by Levene's F-test is shown.

References

    1. Falconer DS, Mackay TFC. Essex: Longman, Harlow; 1996. Introduction to Quantitative Genetics.
    1. Lynch M, Walsh B. Sunderland, Massachusetts: Sinauer Associates, Inc; 1998. Genetics and analysis of quantitative traits.
    1. Slatkin M. Epigenetic Inheritance and the Missing Heritability Problem. Genetics. 2009;182:845–850. - PMC - PubMed
    1. Zhang X, Shiu S, Cal A, Borevitz JO. Global analysis of genetic, epigenetic and transcriptional polymorphisms in Arabidopsis thaliana using whole genome tiling arrays. PLoS Genet. 2008;4:e1000032. doi: 10.1371/journal.pgen.1000032. - DOI - PMC - PubMed
    1. Albert R, Barabasi AL. Statistical mechanics of complex networks. Reviews of Modern Physics. 2002;74:47–97.

Publication types

MeSH terms