. 2011 Sep;7(9):e1002300.
doi: 10.1371/journal.pgen.1002300. Epub 2011 Sep 29.

Identification of type 1 diabetes-associated DNA methylation variable positions that precede disease diagnosis

Affiliations

Identification of type 1 diabetes-associated DNA methylation variable positions that precede disease diagnosis

Vardhman K Rakyan et al. PLoS Genet. 2011 Sep.

Abstract

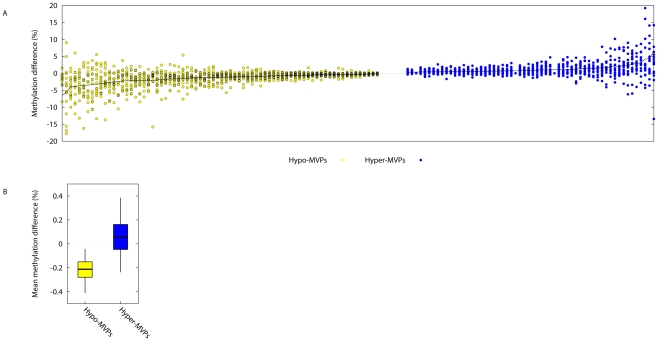
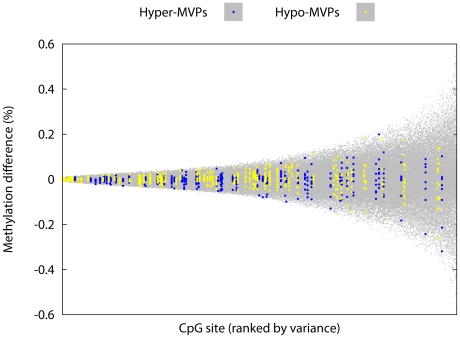
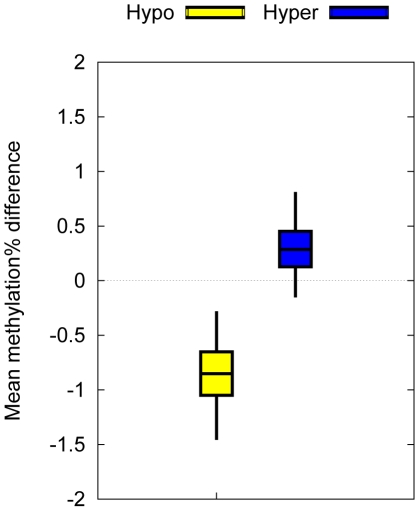
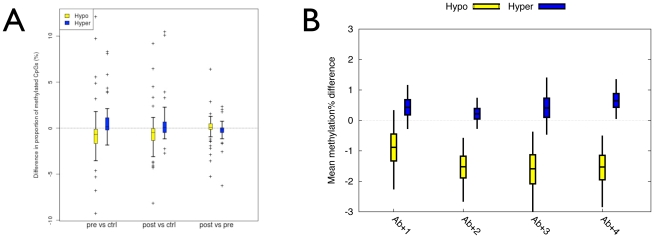
Monozygotic (MZ) twin pair discordance for childhood-onset Type 1 Diabetes (T1D) is ∼50%, implicating roles for genetic and non-genetic factors in the aetiology of this complex autoimmune disease. Although significant progress has been made in elucidating the genetics of T1D in recent years, the non-genetic component has remained poorly defined. We hypothesized that epigenetic variation could underlie some of the non-genetic component of T1D aetiology and, thus, performed an epigenome-wide association study (EWAS) for this disease. We generated genome-wide DNA methylation profiles of purified CD14+ monocytes (an immune effector cell type relevant to T1D pathogenesis) from 15 T1D-discordant MZ twin pairs. This identified 132 different CpG sites at which the direction of the intra-MZ pair DNA methylation difference significantly correlated with the diabetic state, i.e. T1D-associated methylation variable positions (T1D-MVPs). We confirmed these T1D-MVPs display statistically significant intra-MZ pair DNA methylation differences in the expected direction in an independent set of T1D-discordant MZ pairs (P = 0.035). Then, to establish the temporal origins of the T1D-MVPs, we generated two further genome-wide datasets and established that, when compared with controls, T1D-MVPs are enriched in singletons both before (P = 0.001) and at (P = 0.015) disease diagnosis, and also in singletons positive for diabetes-associated autoantibodies but disease-free even after 12 years follow-up (P = 0.0023). Combined, these results suggest that T1D-MVPs arise very early in the etiological process that leads to overt T1D. Our EWAS of T1D represents an important contribution toward understanding the etiological role of epigenetic variation in type 1 diabetes, and it is also the first systematic analysis of the temporal origins of disease-associated epigenetic variation for any human complex disease.


Conflict of interest statement

The authors have declared that no competing interests exist.

Figures

Figure 1
Figure 1. Identification of Type 1 Diabetes-associated DNA methylation variable positions (T1D–MVPs).
(A) On the x-axis, each ‘column’ of data contains 15 different points, indicating the absolute intra-pair DNA methylation difference observed at a single T1D–MVP for each of the 15 different T1D–discordant MZ pairs. Plotted are the 58 different hyper- and 74 different hypoT1D–MVPs that were called at P<0.01. Data are arranged in order of decreasing or increasing absolute intra-MZ pair methylation differences for hypo- (yellow) and hyper- (blue) T1D–MVPs respectively (Refer to Table S2 for numerical values). (B) For each T1D–MVP, we asked whether experimental data is available for a neighboring CpG site within 2 kb genomic distance. In cases where several such CpG sites were present, we considered only the closest neighbor. These data were available for 56 Hypo-T1D–MVPs (out of total 74) and for 39 Hyper-T1D–MVPs (out of total 58). We then quantified the T1D–specific methylation change of these neighboring CpG sites, and plotted the intervals, such that boxes cover 50% and whiskers 95% of the data range.
Figure 2
Figure 2. T1D–MVPs are not due to increased technical and/or biological variability.
We generated Illumina27K profiles for CD14+ cells from 9 different control MZ pairs and calculated intra-MZ pair methylation differences at each probe on the Illumina27K array, for each of the 9 different MZ pairs. Here we plot the variance (around the mean) observed in intra-MZ pair methylation differences at each probe over all 9 MZ pairs (i.e. each ‘column’ of data contains 9 different data-points). For each MZ pair, the choice of the ‘index’ co-twin was arbitrary. CpG sites were ranked in order of increasing sample variance across the 9 intra-pair differences measured at each site. The range of intra-MZ pair variability at T1D–MVP-corresponding probes (highlighted) is significantly less compared with the range of variability observed across other probes on the array (P = 2.4×10⁻⁸, Welch's t-test). Number of probes used in this analysis = 22,645 (of the total 27,458 probes on the array. Refer to the section ‘Array Processing’ in Materials and Methods for the Q.C. steps performed on the arrays).
Figure 3
Figure 3. Biological confirmation of the T1D–MVPs in an independent set of T1D–discordant MZ pairs.
Mean intra-pair methylation differences associated with T1D–MVPs between 4 T1D–discordant MZ pairs not included in the original dataset. Bars indicate 50% bootstrap confidence intervals on the means, and whiskers indicate 95% confidence intervals on the means. We observed a statistically significant DNA methylation difference in the expected direction between hyper and hypoT1D–MVPs (P = 0.0375, Welch's t-test).
Figure 4
Figure 4. Establishment of the temporal origins and additional independent biological confirmation of the T1D–MVPs.
(A) Boxplots of the mean difference in the proportion of CpG sites methylated (%) between 7 pre- or post–T1D diagnosis samples and 18 controls from 9 unaffected MZ pairs or between pre- and post–T1D diagnosis samples at 74 hypo- and 58 hyper-methylated MVPs. Bars indicate 50% bootstrap confidence intervals on the means, and whiskers indicate 95% confidence intervals on the means. (B) Boxplots of the mean difference in the proportion of CpG sites methylated (%) between each of 4 Ab+/T1D–singletons and the same controls as in ‘A’. Bars indicate 50% bootstrap confidence intervals on the means, and whiskers indicate 95% confidence intervals on the means.

References

    1. Todd JA. Etiology of type 1 diabetes. Immunity. 2010;32:457–67. - PubMed
    1. Wellcome Trust Case Control Consortium. Genome-wide association study of 14,000 cases of seven common diseases and 3,000 shared controls. Nature. 2007;447:661–78. - PMC - PubMed
    1. Leslie RD, Delli Castelli M. Age-dependent influences on the origins of autoimmune diabetes: evidence and implications. Diabetes. 2004;53:3033–40. - PubMed
    1. Bach JF. The effect of infections on susceptibility to autoimmune and allergic diseases. N Engl J Med. 2002;347:911–20. - PubMed
    1. Redondo MJ, Yu L, Hawa M, Mackenzie T, Pyke DA, et al. Heterogeneity of type I diabetes: analysis of monozygotic twins in Great Britain and the United States. Diabetologia. 2001;44:354–62. - PubMed

Publication types

MeSH terms

Substances