. 2011 Sep;7(9):e1002301.
doi: 10.1371/journal.pgen.1002301. Epub 2011 Sep 29.

Retrotransposon-induced heterochromatin spreading in the mouse revealed by insertional polymorphisms

Affiliations

Retrotransposon-induced heterochromatin spreading in the mouse revealed by insertional polymorphisms

Rita Rebollo et al. PLoS Genet. 2011 Sep.

Abstract

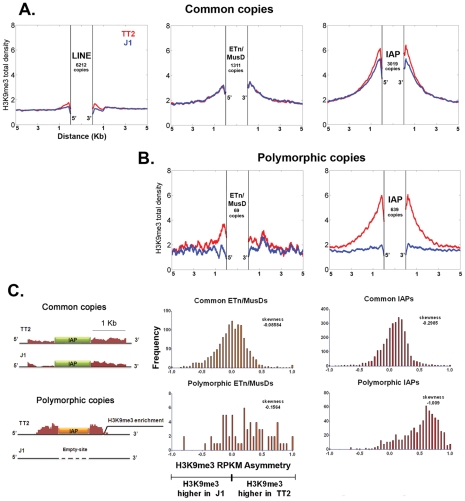
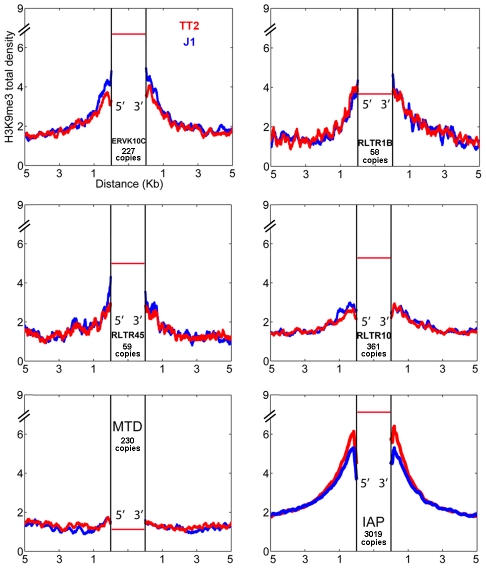
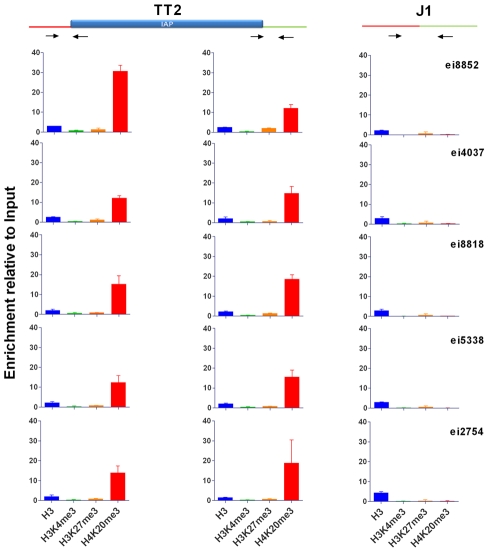
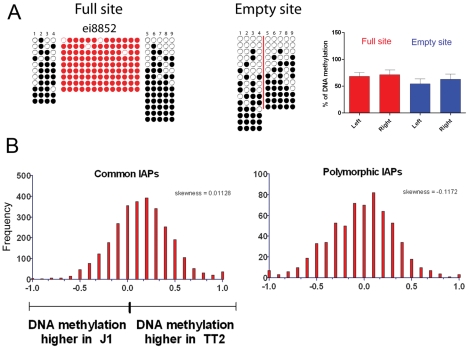
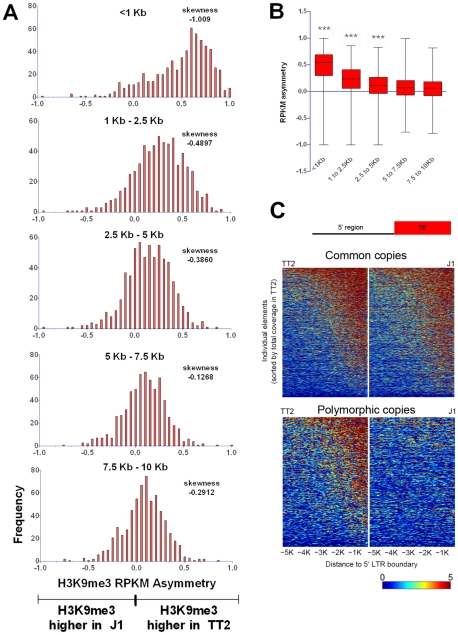
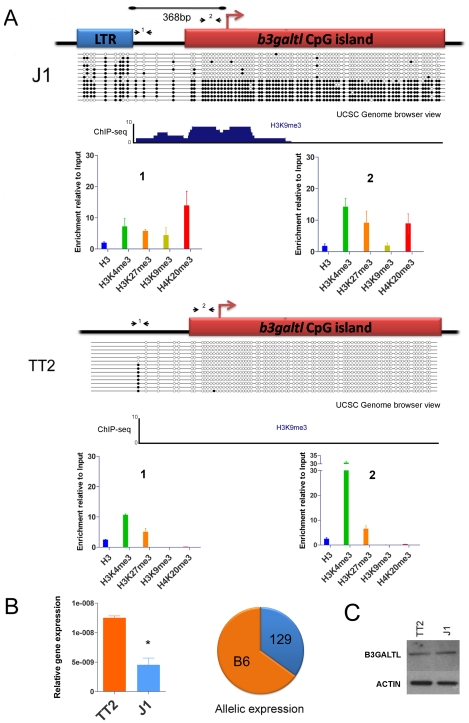
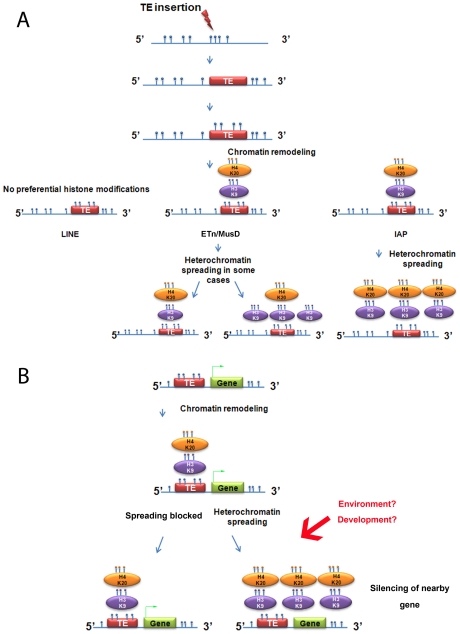
The "arms race" relationship between transposable elements (TEs) and their host has promoted a series of epigenetic silencing mechanisms directed against TEs. Retrotransposons, a class of TEs, are often located in repressed regions and are thought to induce heterochromatin formation and spreading. However, direct evidence for TE-induced local heterochromatin in mammals is surprisingly scarce. To examine this phenomenon, we chose two mouse embryonic stem (ES) cell lines that possess insertionally polymorphic retrotransposons (IAP, ETn/MusD, and LINE elements) at specific loci in one cell line but not the other. Employing ChIP-seq data for these cell lines, we show that IAP elements robustly induce H3K9me3 and H4K20me3 marks in flanking genomic DNA. In contrast, such heterochromatin is not induced by LINE copies and only by a minority of polymorphic ETn/MusD copies. DNA methylation is independent of the presence of IAP copies, since it is present in flanking regions of both full and empty sites. Finally, such spreading into genes appears to be rare, since the transcriptional start sites of very few genes are less than one Kb from an IAP. However, the B3galtl gene is subject to transcriptional silencing via IAP-induced heterochromatin. Hence, although rare, IAP-induced local heterochromatin spreading into nearby genes may influence expression and, in turn, host fitness.


Conflict of interest statement

The authors have declared that no competing interests exist.

Figures

Figure 1
Figure 1. Detecting retrotransposon influence on H3K9me3 chromatin by comparison of common and insertionally polymorphic copies.
A. H3K9me3 total density flanking common LINE (L1MdA), ETn/MusD and IAP copies in TT2 (red) and J1 (blue) cell lines. B. H3K9me3 total density flanking sites of insertionally polymorphic copies of ETn/MusDs and IAPs. Copies are present in TT2 (red) and absent in J1 (blue). C. RPKM asymmetry of H3K9me3 between TT2 and J1. A scheme shows an example of H3K9me3 RPKM comparison. Common copies (in green) and insertionally polymorphic copies (in orange) between both ES cell lines show different theoretical RPKM for H3K9me3 enrichment in the flanking regions (1 Kb – adapted from genome browser). Flanking regions harboring the same RPKM for both ES cell lines will have a RPKM asymmetry of 0 (illustrated with the common copy situation) while flanking regions having different RPKM will engender positive or negative RPKM asymmetries (illustrated with the polymorphic copy - present in TT2 and absent in J1). Note that no multi-mapping was allowed in our analysis creating a gap of H3K9me3 enrichment inside TE sequences themselves. Frequency is the number of copies having a given RPKM asymmetry. The skewness of each distribution is depicted.
Figure 2
Figure 2. ERV influence on H3K9me3 chromatin.
H3K9me3 total density flanking several ERV families in TT2 (red) and J1 (blue) cell lines. The total density of H3K9me3 was calculated on flanking regions (5′ and 3′) of ERVK10C, RLTR1B, RLTR45, RLTR10, MTD and IAPs (plot from Figure 1). All copies analyzed were full-length elements with two LTRs. For families other than IAP, copies are present in B6 (TT2, blue) but their presence in the CBA (TT2) and 129 strains (J1, red) is unknown. The red horizontal bar represents the H3K9me3 enrichment per copy (see also Figure S3A).
Figure 3
Figure 3. Characterization of IAP-induced chromatin by ChIP-qPCR.
Chromatin immunoprecipitation followed by qPCR was done in TT2 (full sites) and J1 (empty sites). Enrichment for all antibodies was tested with positive and negative controls (Figure S10). Arrows represent the primers used for qPCR in both cell lines, where one primer is in the flanking region and the other in the IAP copy. For primers located further away from the IAP see Figure S9. Enrichment is shown as relative to the Input samples and the mean of the two biological replicates is depicted with the standard deviation.
Figure 4
Figure 4. DNA methylation analysis of IAPs in both ES cell lines.
A. Bisulfite conversion was done on DNA from both TT2 (full site) and J1 (empty site) cell lines and PCR followed by sequencing was done for flanking regions in J1, and LTR and flanking regions for TT2. Dark circles are methylated CpGs and empty circles are unmethylated CpGs. Red-colored circles are CpGs within the IAP LTRs and numbered CpGs between full and empty sites correspond to the same CpG site. A red line is depicted in the empty site illustrating the position of the IAP copy in the full site. Only one copy is depicted in this figure, with the remaining 4 copies shown in Figure S11. B. RPKM asymmetry of DNA methylation as measured by MeDIP on flanking regions between TT2 and J1. Common copies are present in both cell lines, polymorphic copies are only present in TT2. See Materials and Methods for asymmetry and skewness calculations.
Figure 5
Figure 5. Length of polymorphic IAP-induced H3K9me3 chromatin.
A. H3K9me3 RPKM asymmetry of insertionally polymorphic IAP copies was calculated for non-overlapping windows of 1.5 kb or 2.5 kb. The <1 kb window reflects the same data depicted in Figure 1C for IAP insertionally polymorphic copies (639 copies). Frequency is the number of copies having a given RPKM asymmetry. B. Whiskers on the sum of H3K9me3 asymmetry for all the different distances analyzed. Kruskal-Wallis and Dunn comparison tests were run and p values <0.001 are shown. C. Heatmap of H3K9me3 spreading in the 5′ flanking sequences of both common and polymorphic copies (for the 3′ region see Figure S12).
Figure 6
Figure 6. Impact of IAP-induced chromatin on the B3galtl gene.
A. Full and empty site analysis of chromatin state and DNA methylation. Bisulfite methylation analysis and ChIP-qPCR were performed in TT2 (empty site) and J1 (full site) cell lines. The distance between the IAP copy and the transcriptional start site of the B3galtl gene in J1 is 368 bp. Small arrows represent qPCR primers used for both ES cell lines (fragments 1 and 2), dark circles are methylated CpGs and empty circles are unmethylated CpGs. The bisulfite representation diagram approximates the relative distance between CpGs. A genome browser view of the region analyzed by bisulfite is shown for H3K9me3 in both cell lines. Note that no enrichment of H3K9me3 is observed in TT2. A larger view of the B3galtl promoter and available histone marks is depicted in Figure S14. B. B3galtl expression in both ES cell lines and allelic expression in 129/B6 ES hybrids. RTqPCR was carried out in both cell lines, the mean of two biological replicates and standard deviation is depicted. The expression was calculated relative to the three most stable genes tested with genorm (actin, tubulin and TBP – see Materials and Methods for more information). T student p-value = 0.0111. The pie chart represents the allelic expression in 129/B6 hybrid ES cells calculated as described in Materials and Methods. C. Western blot analysis of B3GALTL in TT2 (empty site) and J1 (full site) protein lysates. ACTIN is depicted to show no difference in protein loading. Westerns were done with biological triplicates and the results were consistent (Figure S16).
Figure 7
Figure 7. Summary of heterochromatin spreading due to transposable elements in mouse ES cell lines.
A. Summary of the data obtained with the insertionally polymorphic families LINE, ETn/MusD and IAP. H4K20me3 on ETn/MusD was shown by Mikkelsen et al. . B. Possible consequences of IAPs or ETn/MusDs near a gene. Blue circles represent methyl groups; if present directly on the DNA molecule they illustrate DNA methylation and if on an oval, a histone methylation. The green arrow on the gene represents transcription.

Similar articles

Cited by

References

    1. Biemont C, Vieira C. Genetics: junk DNA as an evolutionary force. Nature. 2006;443:521–524. - PubMed
    1. Rebollo R, Horard B, Hubert B, Vieira C. Jumping genes and epigenetics: Towards new species. Gene. 2010;454:1–7. - PubMed
    1. Hedges DJ, Deininger PL. Inviting instability: Transposable elements, double-strand breaks, and the maintenance of genome integrity. Mutat Res. 2007;616:46–59. - PMC - PubMed
    1. Feschotte C. Transposable elements and the evolution of regulatory networks. Nat Rev Genet. 2008;9:397–405. - PMC - PubMed
    1. Jordan IK, Matyunina LV, McDonald JF. Evidence for the recent horizontal transfer of long terminal repeat retrotransposon. Proc Natl Acad Sci U S A. 1999;96:12621–12625. - PMC - PubMed

Publication types