. 2011 Sep;7(9):e1002306.
doi: 10.1371/journal.pgen.1002306. Epub 2011 Sep 29.

MicroRNA predictors of longevity in Caenorhabditis elegans

Affiliations

MicroRNA predictors of longevity in Caenorhabditis elegans

Zachary Pincus et al. PLoS Genet. 2011 Sep.

Abstract

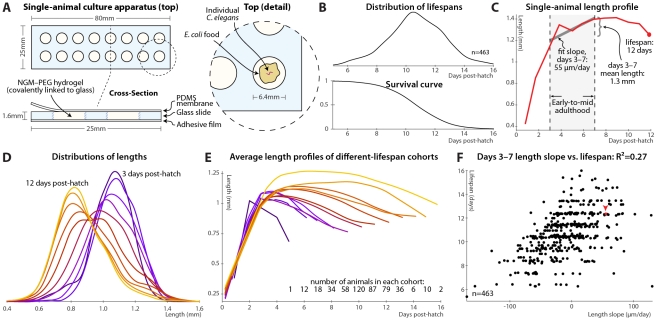
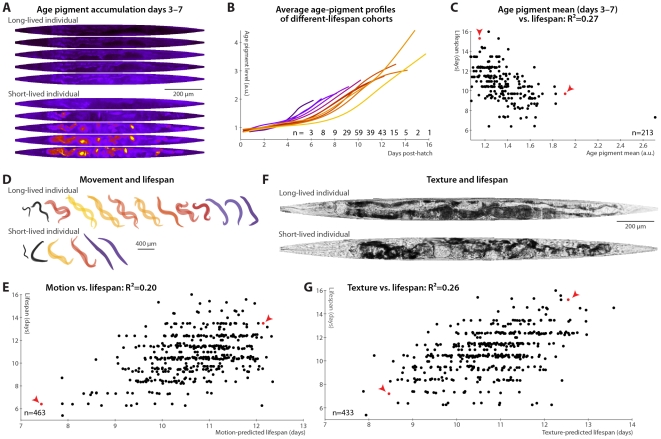
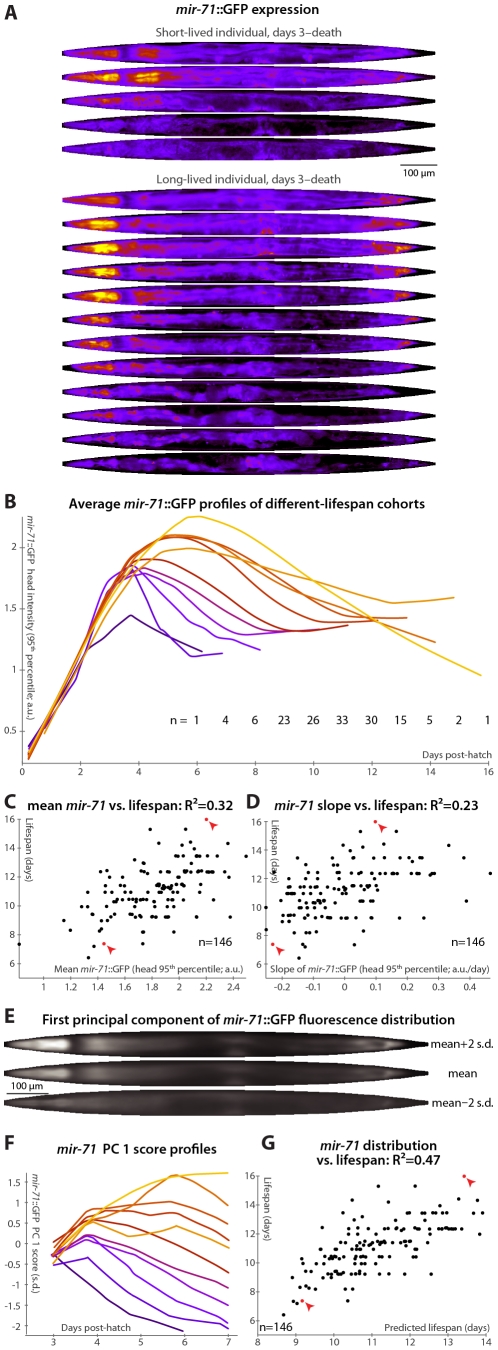
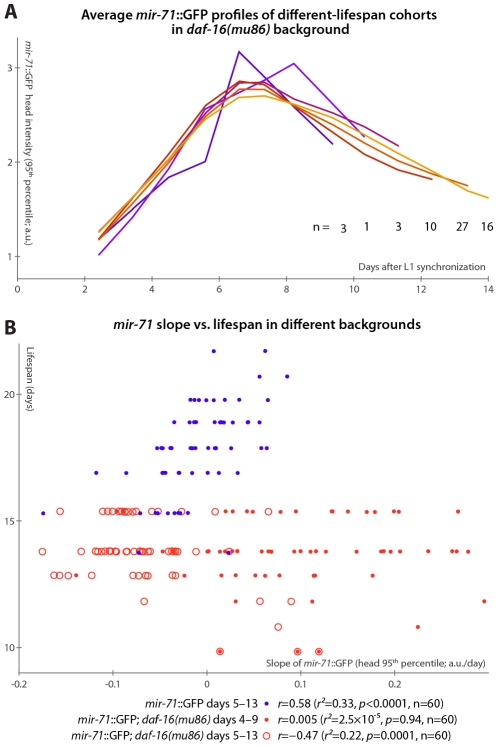
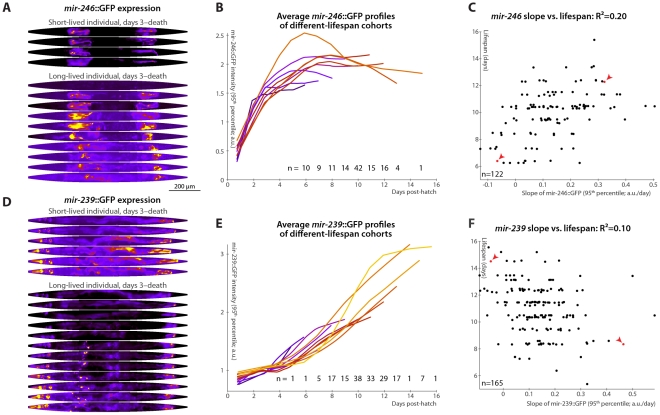
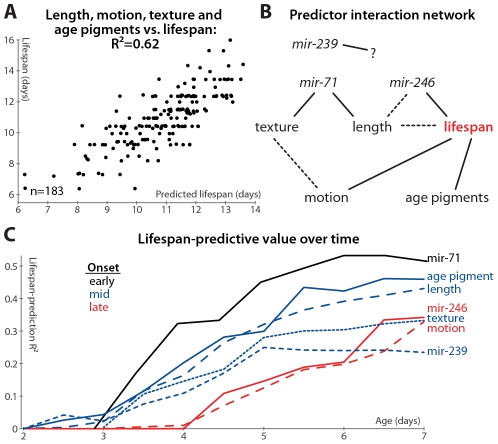
Neither genetic nor environmental factors fully account for variability in individual longevity: genetically identical invertebrates in homogenous environments often experience no less variability in lifespan than outbred human populations. Such variability is often assumed to result from stochasticity in damage accumulation over time; however, the identification of early-life gene expression states that predict future longevity would suggest that lifespan is least in part epigenetically determined. Such "biomarkers of aging," genetic or otherwise, nevertheless remain rare. In this work, we sought early-life differences in organismal robustness in unperturbed individuals and examined the utility of microRNAs, known regulators of lifespan, development, and robustness, as aging biomarkers. We quantitatively examined Caenorhabditis elegans reared individually in a novel apparatus and observed throughout their lives. Early-to-mid-adulthood measures of homeostatic ability jointly predict 62% of longevity variability. Though correlated, markers of growth/muscle maintenance and of metabolic by-products ("age pigments") report independently on lifespan, suggesting that graceful aging is not a single process. We further identified three microRNAs in which early-adulthood expression patterns individually predict up to 47% of lifespan differences. Though expression of each increases throughout this time, mir-71 and mir-246 correlate with lifespan, while mir-239 anti-correlates. Two of these three microRNA "biomarkers of aging" act upstream in insulin/IGF-1-like signaling (IIS) and other known longevity pathways, thus we infer that these microRNAs not only report on but also likely determine longevity. Thus, fluctuations in early-life IIS, due to variation in these microRNAs and from other causes, may determine individual lifespan.


Conflict of interest statement

The authors have declared that no competing interests exist.

Figures

Figure 1
Figure 1. Single-animal vermiculture and measurement.
(A) Individual C. elegans and their bacterial food source live atop a gel pad, sealed with a gas-permeable polydimethylsiloxane (PDMS) membrane. (B) Variability in individual lifespans is clear from the distribution of lifespans of 463 animals reared in this apparatus, reconstructed via kernel density estimation. The corresponding survival curve is shown below the lifespan distribution, and represents precisely the same data. We prefer the distribution, as features such as bimodality and differences in variance are easier to identify. (C) Time-course of measured length for a single individual throughout its life. Early-to-mid-adulthood patterns in this (and other) measurements are summarized as the average level between days 3 and 7, and the slope of a least-squares fit line to the data in that range. (D) Kernel density estimates of the distribution of lengths of animals at different ages post-hatch, colored by age on a blue-red-yellow spectrum, demonstrate a general shrinkage with aging. (E) The average length over time is shown for cohorts of animals, grouped according to the number of days lived. Shorter-lived animals are in general smaller and shrink in size more quickly. (F) Size maintenance during adulthood (measured as the slope of the least-squares fit of age vs. length, days 3–7 post-hatch) correlates with eventual lifespan; R2 = 0.27 (p<10−33); the leave-one-out (l.o.o.) estimate of future predictive ability is also 0.27. The point corresponding to the individual in panel B is shown in red and marked with an arrowhead. Multivariate regression of lifespan against both length slope and days 3–7 mean length yields an R2 of 0.32 (p<10−38; l.o.o. 0.31).
Figure 2
Figure 2. Phenomenological predictors of nematode longevity.
(A) Autofluorescence images of two individual nematodes with different rates of age pigment accumulation at days 3–7 (top–bottom). Images were warped to the average day-5 shape and size for simple comparison and pseudocolored on a black-blue-red-yellow spectrum to provide sufficient dynamic range. (B) The average level of age pigment accumulation (measured as the 95th percentile of whole-body autofluorescent intensity) over time is shown for cohorts grouped by lifespan. Shorter-lived animals in general have higher and faster-rising autofluorescence. (C) Average levels of age pigment, measured between days 3 and 7, anti-correlate with longevity; R2 = 0.27 (p<10−15; l.o.o. 0.25); the slope of autofluorescence accumulation, days 3–7 (as in B) correlates similarly well. Both parameters jointly regressed against lifespan yield an R2 of 0.31 (p<10−16; l.o.o. 0.28). Points corresponding to the individuals in panel A are red and marked with arrowheads. (D) Movement rates of a long-lived and a short-lived animal throughout their lives are illustrated at each day of life by showing, superimposed, the animal's position in two images acquired 0.5 seconds apart. From day 3 onward, these animals are colored according to the movement score (see text) on a black-blue-red-yellow spectrum. The longer-lived animal moves more, both qualitatively and quantitatively. (E) Regressing both the mean motion score between days 3 and 7 and the slope in that time range against each animal's lifespan yields an R2 of 0.20 (p<10−22; l.o.o. 0.19). The data points corresponding to the individuals in panel D in red and marked with arrowheads. (F) Straightened brightfield images of a texturally decrepit (bottom) and non-decrepit (top) individual, both 7 days post-hatch. (G) A “texture decrepitude” score is calculated daily (see text); the mean score between days 3 and 7 and over the slope in that time range jointly predict each individual's longevity with an R2 of 0.26 (p<10−28; l.o.o. 0.25). The data points corresponding to the individuals in panel F in red and marked with arrowheads.
Figure 3
Figure 3. mir-71::GFP levels and expression patterns predict longevity.
(A) Daily images of mir-71::GFP expression patterns for two individuals, from day 3 to the last day of life are shown (top–bottom), straightened and pseudocolored as in Figure 2A. (B) Average mir-71::GFP expression (measured as the 95th percentile of head-region intensity) versus time is shown for cohorts with different longevities. Shorter-lived animals have, in general, lower and more rapidly declining levels of mir-71::GFP expression. (C,D) The mean of (C) and slope of a fit line to (D) days 3–7 mir-71::GFP expression correlates with each animal's future longevity. Regressing both jointly against longevity yields an R2 of 0.35 (p<10−13; l.o.o. 0.32). (E) The mean of 979 warped and aligned images of mir-71::GFP expression is shown, along with synthetic images illustrating two-standard-deviation offsets from that mean along the first principle component (PC1; the set of correlated changes in pixel intensities that together explain the maximal variance in the data set). In this case, PC1 spans 18% of the variability in the image data. This component reflects changes in the tissue-specificity of mir-71::GFP expression. An image can be scored in terms of standard deviations from the mean along this component (PC score); more positive scores indicate head/vulva/tail specificity and more negative scores indicate diffuse background expression. (F) Trends in PC scores (calculated only between days 3 and 7) are shown for the different-longevity cohorts in panel B. Higher scores and slowly falling scores are clearly associated with longer life. (G) The mean and fit slope of the PC scores of days 3–7 mir-71::GFP expression jointly predict future longevity; R2 = 0.47 (p<10−19; l.o.o. 0.45). The use of this prediction as a test for actual above-average longevity (including sensitivity and specificity figures) is shown in Figure S2D.
Figure 4
Figure 4. mir-71::GFP levels do not positively correlate with longevity absent DAF-16.
(A) Average mir-71::GFP expression (measured as the 95th percentile of head-region intensity) versus time is shown for cohorts of mir-71::GFP; daf-16(mu86) animals with different longevities. In contrast to Figure 3B, without DAF-16, longer-lived cohorts are not clearly distinct from shorter-lived cohorts in terms of temporal trends in mir-71::GFP expression. (B) The relationship between the slope of mir-71::GFP expression in the head in a defined time window and ultimate lifespan is shown for various strains and time windows. Blue circles mark mir-71::GFP animals, measured days 5–13 (which corresponds to the day 3–7 window after adjusting for the different lifespan induced by the culture conditions; see Materials and Methods and Figure S5A). Closed red circles mark mir-71::GFP; daf-16(mu86) animals measured days 4–9 (an adjustment accounting for the shortened lifespan of the strain), while open red circles mark the same strain measured days 5–15. In all cases, the reported correlation values do not strongly depend on the starting day.
Figure 5
Figure 5. Changes in mir-246::GFP and mir-239::GFP expression over time predict longevity.
(A,D) Daily images of mir-246::GFP (A) or mir-239::GFP (D) expression patterns for two individuals, from day 3 to the last day of life are shown (top-to-bottom), straightened and pseudocolored as in Figure 2A. (B,E) Average mir-246::GFP (B) or mir-239::GFP (E) expression (measured as the 95th percentile of whole-body intensity) versus time is shown for cohorts with different longevities. Shorter-lived animals have, in general, more rapidly declining levels of mir-246::GFP expression and slightly more rapidly increasing levels of mir-239::GFP. (C) The slope of a fit line to mir-246::GFP intensity between days 3 and 7 correlates with each animal's future longevity; R2 = 0.20 (p<10−6; l.o.o. 0.18). Points corresponding to the individuals shown in panel A are in red and marked with arrowheads. (F) The slope of mir-239::GFP, days 3–7, anti-correlates with future longevity; R2 = 0.10 (p<10−4; l.o.o. 0.070). Individuals from panel D are in red and marked with arrowheads. The use of the predictions from panels C and F as tests for actual above-average longevity (including sensitivity and specificity figures) are shown in Figure S2E and S2F.
Figure 6
Figure 6. Multivariate lifespan predictions and relationships between biomarkers.
(A) Multivariate regression of length (days 3–7 mean and slope of fit line), motion (mean and slope), texture decrepitude (mean and slope), and autofluorescence accumulation (slope) against lifespan yields a predicted lifespan or “survival index” that explains 62% of variability in future longevity. (p<10−32; l.o.o. estimate 57%; see also Figure S2G). (B) A partial correlation network illustrates the pattern of conditional independences between measured parameters, which are directly connected if and only if they correlate with one another after controlling for all subsets of other parameters. The network shown is a consensus from several datasets (see Figure S6); dashed lines indicate relations that are not fully consistent, and mir-239 cannot be placed into the network at all. (C) Lifespan-predictive ability of each biomarker as a function of age. R2 values from regressing lifespan against biomarker measurements up to a given age are plotted versus that age. (Texture, motion, and mir-71::GFP PCA measures were calculated only from day 3 onward.)

References

    1. Gögele M, Pattaro C, Fuchsberger C, Minelli C, Pramstaller PP, et al. Heritability Analysis of Life Span in a Semi-isolated Population Followed Across Four Centuries Reveals the Presence of Pleiotropy Between Life Span and Reproduction. J Gerontol A Biol Sci Med Sci. 2010;705:1–12. - PubMed
    1. Herskind AM, McGue M, Holm NV, Sørensen TI, Harvald B, et al. The heritability of human longevity: a population-based study of 2872 Danish twin pairs born 1870–1900. Hum Genet. 1996;97:319–323. - PubMed
    1. Horiuchi S. Interspecies Differences in the Life Span Distribution: Humans versus Invertebrates. Pop Dev Review. 2003;29:127–151.
    1. Vaupel JW, Carey JR, Christensen K, Johnson TE, Yashin AI, et al. Biodemographic trajectories of longevity. Science. 1998;280:855–860. - PubMed
    1. Brooks A, Lithgow GJ, Johnson TE. Mortality rates in a genetically heterogeneous population of Caenorhabditis elegans. Science. 1994;263:668–671. - PubMed

Publication types