. 2011 Sep;7(9):e1002309.
doi: 10.1371/journal.pgen.1002309. Epub 2011 Sep 29.

Cell type-specific transcriptome analysis reveals a major role for Zeb1 and miR-200b in mouse inner ear morphogenesis

Affiliations

Cell type-specific transcriptome analysis reveals a major role for Zeb1 and miR-200b in mouse inner ear morphogenesis

Ronna Hertzano et al. PLoS Genet. 2011 Sep.

Abstract

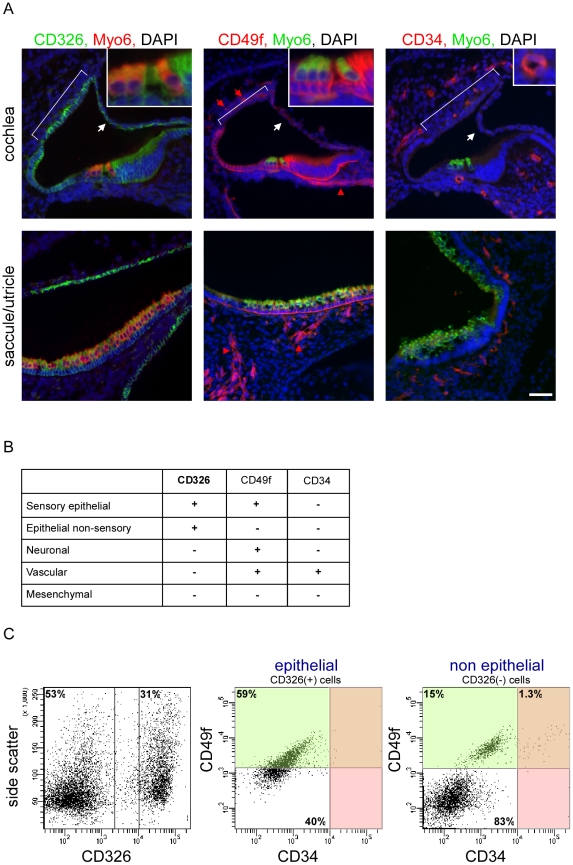
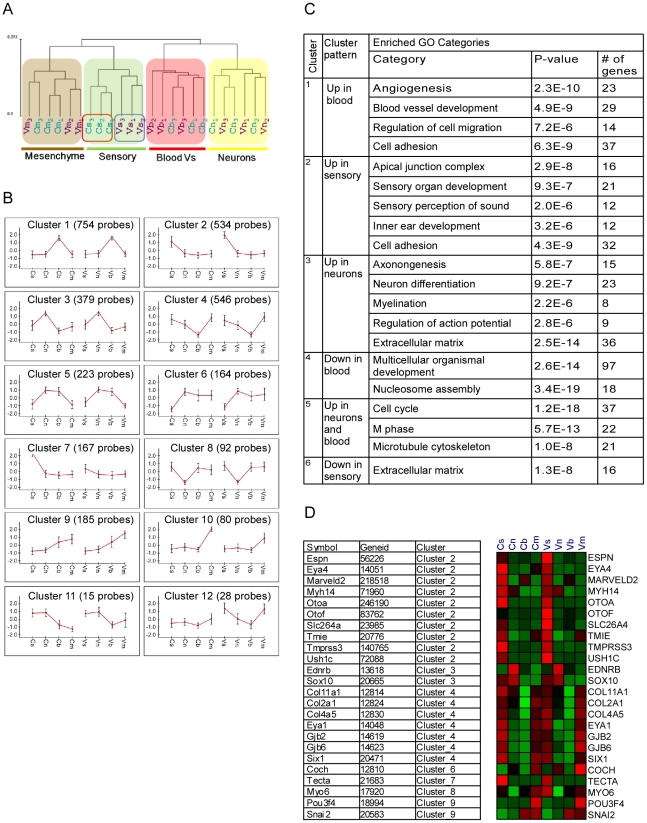
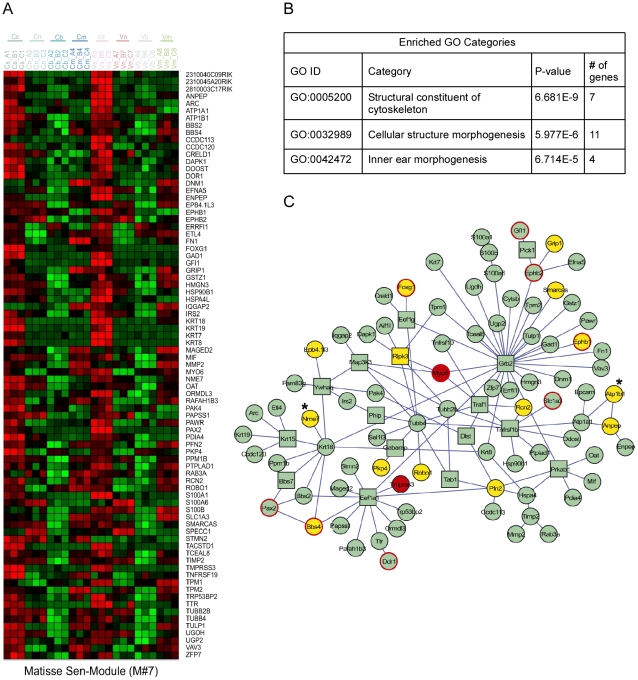
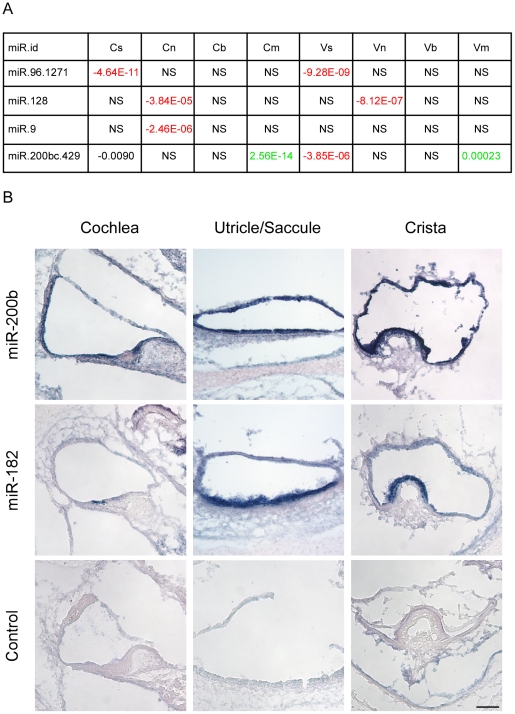
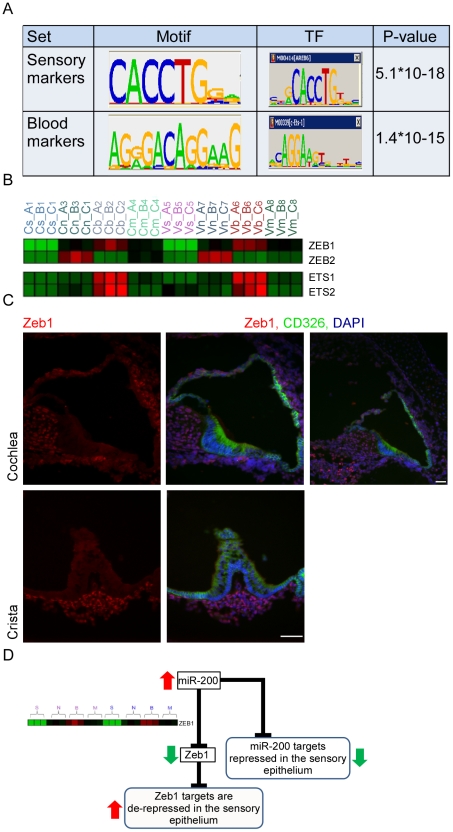
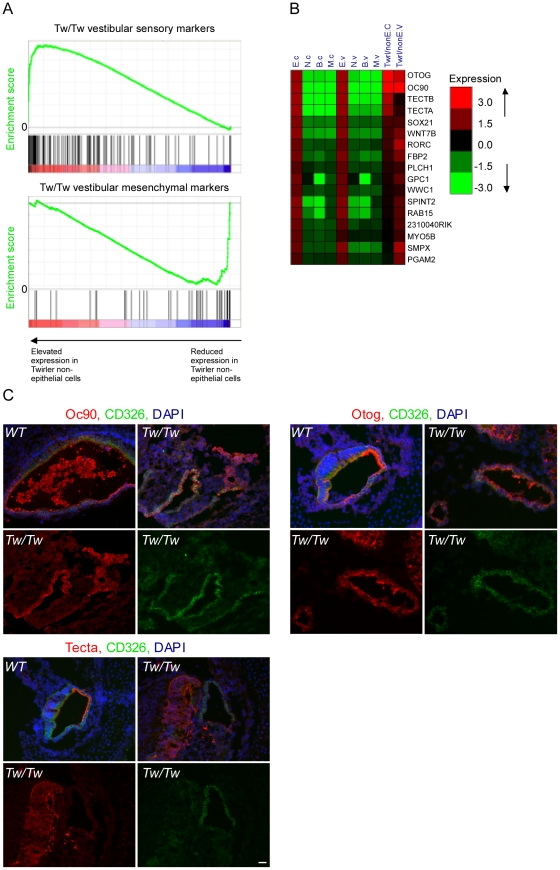
Cellular heterogeneity hinders the extraction of functionally significant results and inference of regulatory networks from wide-scale expression profiles of complex mammalian organs. The mammalian inner ear consists of the auditory and vestibular systems that are each composed of hair cells, supporting cells, neurons, mesenchymal cells, other epithelial cells, and blood vessels. We developed a novel protocol to sort auditory and vestibular tissues of newborn mouse inner ears into their major cellular components. Transcriptome profiling of the sorted cells identified cell type-specific expression clusters. Computational analysis detected transcription factors and microRNAs that play key roles in determining cell identity in the inner ear. Specifically, our analysis revealed the role of the Zeb1/miR-200b pathway in establishing epithelial and mesenchymal identity in the inner ear. Furthermore, we detected a misregulation of the ZEB1 pathway in the inner ear of Twirler mice, which manifest, among other phenotypes, malformations of the auditory and vestibular labyrinth. The association of misregulation of the ZEB1/miR-200b pathway with auditory and vestibular defects in the Twirler mutant mice uncovers a novel mechanism underlying deafness and balance disorders. Our approach can be employed to decipher additional complex regulatory networks underlying other hearing and balance mouse mutants.


Conflict of interest statement

The authors have declared that no competing interests exist.

Figures

Figure 1
Figure 1. A novel cell type–specific protocol to sort the inner ear sensory organs.
[A] Expression of CD326, CD49f and CD34 in the newborn mouse inner ear. Sections of P0 cochlear ducts (upper panel) and utricles/saccules (lower panels) from mouse inner ears immunolabeled with antibodies for CD326 (left panel), CD49f (middle panel) and CD34 (right panel), and counter-stained with an antibody for Myo6 – a hair cell-specific protein in the mouse inner ear, and DAPI (blue). CD326 labels all of the epithelial cells in the auditory (cochlea) and vestibular (saccule, utricle and semicircular canals) organs including the non-sensory epithelial cells of Reissner's membrane (white arrows) and the stria vascularis (bracket) in the cochlea. CD49f marks the sensory epithelium as well as the neuronal (red arrowhead) and vascular endothelial cells (red arrow). CD34 is specifically expressed in the vascular endothelium, thereby marking the blood vessels. Scale bar  =  50 µm, insets  =  150 µm. [B] Cell type–specific CD expression. [C] FACS plot analysis from newborn auditory epithelia of wild type mice. Cells are sorted based on expression of CD326 (here 53% and 31% negative and positive, respectively), are further divided based on the expression of CD49f and CD34 (for CD326-positive cells 59% and 40% are CD49f positive and negative, respectively; for CD326-negative cells 16.3% and 83% are CD49f positive and negative, respectively. 1.3% of the CD-326 negative cells are CD49f and CD34 positive). For simplification - the area marked in green represent CD49f-positive cells, and the area marked in red represent CD34-positive cells. See also Figure S1.
Figure 2
Figure 2. Analysis of the inner ear cell type–specific transcriptome.
[A] Hierarchical clustering of the expression data resulted in a dendrogram in which the main partition of samples is according to cell-type (s-sensory, m-mesenchymal, n-neuron and b-blood cells). The auditory (C) and vestibular (V) samples clustered into separate branches only for the sensory epithelial cells. Samples from the auditory and vestibular systems are marked in blue and purple, respectively. Numbers represent the independent biological repeats. [B] Main expression patterns exhibited by the differential genes as identified by k-means clustering. Each cluster is represented by its mean expression pattern ± SD. (Prior to clustering, gene expression levels were standardized to mean = 0, SD = 1. Y-axis in the cluster view shows the standardized levels). At the top of each pattern, the title indicates the cluster number and the number of probes assigned to the cluster. Table S2 contains a list of the genes in each cluster. [C] A table depicting the observed enriched Gene-Ontology (GO) functional groups in six of the clusters. [D] A heat map depicting the expression patterns of deafness-related genes (right) and their assignment to the clusters (left). Red and green indicate increased and decreased expression, respectively.
Figure 3
Figure 3. Expression-interaction module of genes which are highly expressed in sensory cells of the inner ear and are physically connected in the cellular protein-protein interaction web.
[A] Heat map showing the inner ear expression pattern of the genes in this module. [B] GO functional categories which are statistically over-represented in this module. [C] Physical links between the proteins encoded by the genes of this module. Node's shape (circle verses square): several proteins were added to the module by the algorithm to keep other members connected although they do not share the module's characteristic expression pattern. These proteins are displayed by box nodes. Node's color: Known deafness-related genes are marked in red; genes which are located within deafness loci are marked in yellow. Genes whose mutations were reported to result in malformation of the inner ear in mouse but do not underlie human disease are marked by red frame. ATP1B1 and NME7 are candidate genes for DFNA7 and are marked with asterisks. See also Figure S3.
Figure 4
Figure 4. Identification of cell type–specific miRNA in the newborn mouse inner ear.
[A] miRNAs whose predicted targets were significantly down-regulated in specific cell types. Each cell reports p-value for the comparison in the indicated cell-type between fold-change distribution of the targets of the indicated miRNA and all the rest of genes (see Materials and Methods). Negative sign indicates down-regulation of the miRNA targets; positive – up-regulation; NS = Not significant difference (p-value>10-5). [B] miR200b is expressed in all epithelial cells of the newborn mouse inner ear. Sections of whole mount in situ hybridizations that were performed on newborn mouse inner ears, with probes for miR200b, miR182 (as a hair cell-specific positive control) and no-probe control. Inner ears were then sectioned. Representative sections from the cochlear duct, otolith organs and crista ampullaris are shown. Scale bar  =  150 µm.
Figure 5
Figure 5. Key regulators of the inner ear transcriptome.
[A] Enriched cis-regulatory motifs found in the promoters of marker genes. The motif enriched in the promoters of the sensory markers corresponds to the binding signature of Zeb1/2 transcription factors, while the motif enriched in the promoters of the endothelial markers corresponds to the binding signature of Ets1/2 transcription factors. “0” indicates no-enrichment. [B] Expression profiles of Zeb1/2 and Ets1/2 in our dataset are in full accord with the prediction of the motif enrichment analysis: Ets1/2 are highly expressed in endothelial cells while expression of Zeb1/2 is excluded from sensory cells. Color legend: red and green indicates increase and decrease in expression, respectively. [C] Zeb1 is expressed in the non-epithelial cells of the mouse inner ear. Sections of inner ears from newborn wild-type mice were stained with an antibody that detects Zeb1 (red), an antibody for CD326 (green) – which marks the epithelial cells in the mouse inner ear and DAPI to counter stain cell nuclei. Note that Zeb1 is not expressed in the epithelial cells of the inner ear (white asterisks). Upper right image – a low magnification image showing that Zeb1 is expressed in most of the non-epithelial cells, including the cells of the spiral ganglion (green asterisk). Scale bar  =  50 µm. See also Figure S5. [D] A model for the function of the miR-200 family in the sensory epithelium of the inner ear.
Figure 6
Figure 6. Deregulation of Zeb-1 pathway in the inner-ears of Twirler mutant mice.
[A] Top panel – gene expression analysis of CD326-negative cells sorted from Tw/Tw mice show increase in epithelial specific markers in the Tw/Tw mutants compared with their wild type littermate controls. Genes were sorted along the X-axis according to their fold-change between the two genotypes, and the distribution of epithelial marker genes in this sorted list was examined using Gene-Set Enrichment Analysis (GSEA) tool (location of the marker genes in the sorted list is indicated by vertical bars). The epithelial marker genes were significantly enriched among genes whose expression was elevated in Tw/Tw CD326-negative cells (p = 1.2*10−15, Wilcoxon test). Lower panel - gene expression analysis of CD326-negative cells sorted from Tw/Tw mice shows decrease in mesenchymal specific markers in the Tw/Tw mutants compared with their wild type littermate controls (p = 1.72*10−10). [B] Many putative Zeb1 targets are de-repressed in CD326-negative cells in Tw/Tw mice inner ear. Log2 fold of change of genes with differential expression in the CD326-negative cells of the Tw/Tw mice compared with their wild type littermate controls. All listed genes harbor a Zeb1 binding site within their promoters. [C] The expression of Oc90, otogelin and α-tectorin is altered in the Tw/Tw mice. In wild type mice Oc90, otogelin and α-tectorin are expressed in the extracellular matrices and epithelial compartment, here marked in green by CD326. In Tw/Tw mice a robust expression of Oc90, otogelin and α-tectorin is noted also in the non-epithelial compartment (areas with expression of Oc90, otogelin and α-tectorin which do not overlap with CD326 expression). In each of the three panels the upper two figures represent merged images of the staining of the altered gene, CD326 and DAPI in wild type (left) and Tw/Tw ears (right) and the lower two figures show the unmerged staining of the altered gene (left) and CD326 (right). Scale bar  =  50 µm.
Figure 7
Figure 7. Cell type–specific targets of miR-96.
Cell type–specific expression of the nine most likely miR-96 targets suggested by Lewis et al. (A) and according to our dataset (B). Cs, Cn, Cb and Cm represent expression values in sensory epithelial, neuronal, vascular endothelial and mesenchymal cells from newborn wild type cochleae. Green and red cells indicate relative decreased and increased expression relative to the average expression across all cell types, respectively.

References

    1. Friedman TB, Schultz JM, Ben-Yosef T, Pryor SP, Lagziel A, et al. Recent advances in the understanding of syndromic forms of hearing loss. Ear Hear. 2003;24:289–302. - PubMed
    1. Raviv D, Dror AA, Avraham KB. Hearing loss: a common disorder caused by many rare alleles. Ann NY Acad Sci. 2010;1214:168–79. - PMC - PubMed
    1. Friedman LM, Dror AA, Avraham KB. Mouse models to study inner ear development and hereditary hearing loss. Int J Dev Biol. 2007;51:609–631. - PubMed
    1. Hertzano R, Puligilla C, Chan SL, Timothy C, Depireux DA, et al. CD44 is a marker for the outer pillar cells in the early postnatal mouse inner ear. J Assoc Res Otolaryngol. 2010;11:407–418. - PMC - PubMed
    1. Nielsen JS, McNagny KM. Novel functions of the CD34 family. J Cell Sci. 2008;121:3683–3692. - PubMed

Publication types

MeSH terms

LinkOut - more resources