

A quantitative theory of solid tumor growth, metabolic rate and vascularization
- PMID: 21980335
- PMCID: PMC3182997
- DOI: 10.1371/journal.pone.0022973
A quantitative theory of solid tumor growth, metabolic rate and vascularization
Abstract
The relationships between cellular, structural and dynamical properties of tumors have traditionally been studied separately. Here, we construct a quantitative, predictive theory of solid tumor growth, metabolic rate, vascularization and necrosis that integrates the relationships between these properties. To accomplish this, we develop a comprehensive theory that describes the interface and integration of the tumor vascular network and resource supply with the cardiovascular system of the host. Our theory enables a quantitative understanding of how cells, tissues, and vascular networks act together across multiple scales by building on recent theoretical advances in modeling both healthy vasculature and the detailed processes of angiogenesis and tumor growth. The theory explicitly relates tumor vascularization and growth to metabolic rate, and yields extensive predictions for tumor properties, including growth rates, metabolic rates, degree of necrosis, blood flow rates and vessel sizes. Besides these quantitative predictions, we explain how growth rates depend on capillary density and metabolic rate, and why similar tumors grow slower and occur less frequently in larger animals, shedding light on Peto's paradox. Various implications for potential therapeutic strategies and further research are discussed.
Conflict of interest statement
Figures

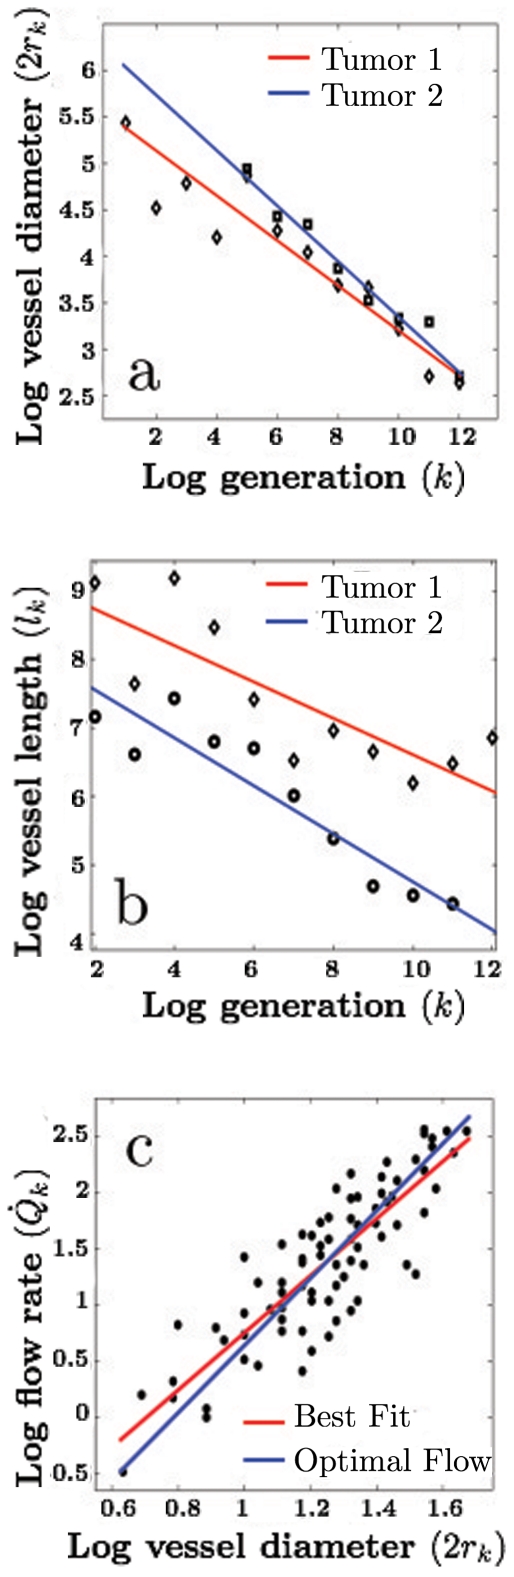
 versus
  . The absolute value of the slope represents the exponent
  , defined as the ratio of radii between consecutive levels:
  . Tumor 1: Mammary Carcinoma 1 (red line/squares):
  . Tumor 2: Colorectal Carcinoma (blue line/diamonds):
  . (b) Same as (a) but for the ratio of lengths between consecutive levels:
  . Tumor 1: Mammary Carcinoma (red line/diamonds):
  . Colorectal Carcinoma (blue line/circles):
  . (c) Plot of the logarithm of flow rate versus logarithm of vessel diameter, showing the predicted idealized cubic law (blue line
  ) and the best linear fit (red line
  ). Data from and .
 , as a function of the total tumor mass,
 . Theory predicts that
  . In this case,
  , so that for these tumors
  , implying a high blood-flow/metabolic rate. However, since these data are drawn from multiple tumors, it represents an estimate. Data from .
 is the tumor mass at time
  ,
,  is the initial mass,
  is the asymptotic mass,
  is the rate of exponential growth,
  is the viable mass scaling exponent, and
  is a characteristic time constant for tumor cells that is given by the ratio of the metabolic rate of a tumor cell to the energy to create a tumor cell. Fits to several types of tumors implanted in mice and rats yield the parameter values with corresponding confidence intervals of: (a) EMT6 exponential:
  ,
,  ; EMT6 sigmoidal:
  ,
,  . (b) KHJJ exponential:
  ,
,  ; KHJJ sigmoidal:
  ,
,  . (c) NCTC2472 exponential:
  ,
,  ; NCTC2472 sigmoidal:
  ,
,  . (d) C3H exponential:
  ,
,  ; C3H sigmoidal:
  ;
;  . Using
  based on the fit from Fig. 3, we compute that for the tumor types in panels (a)–(d),
  ,
,  ,
,  , and
, and  respectively, which is remarkably consistent given the amount of error in the data. Data from .
References
-
- West GB, Brown JH, Enquist BJ. A general model for the origin of allometric scaling laws in biology. Science. 1997;276:122–126. - PubMed
-
- Zamir M. Scaling in Biology. New York, NY: Oxford University Press; 2000. pp. 129–145. chapter 8.
-
- Huo Y, Kassab GS. Pulsatile blood ow in the entire coronary arterial tree: theory and experiment. Am J Physiol-Heart C. 2006;291:H1074–H1087. - PubMed
