

A global clustering algorithm to identify long intergenic non-coding RNA--with applications in mouse macrophages
- PMID: 21980340
- PMCID: PMC3184070
- DOI: 10.1371/journal.pone.0024051
A global clustering algorithm to identify long intergenic non-coding RNA--with applications in mouse macrophages
Abstract
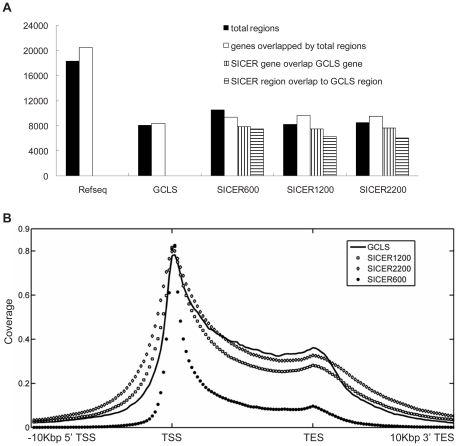
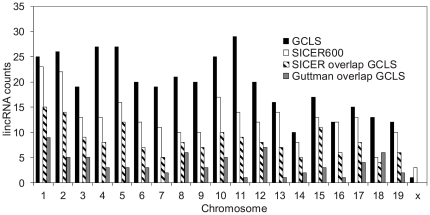
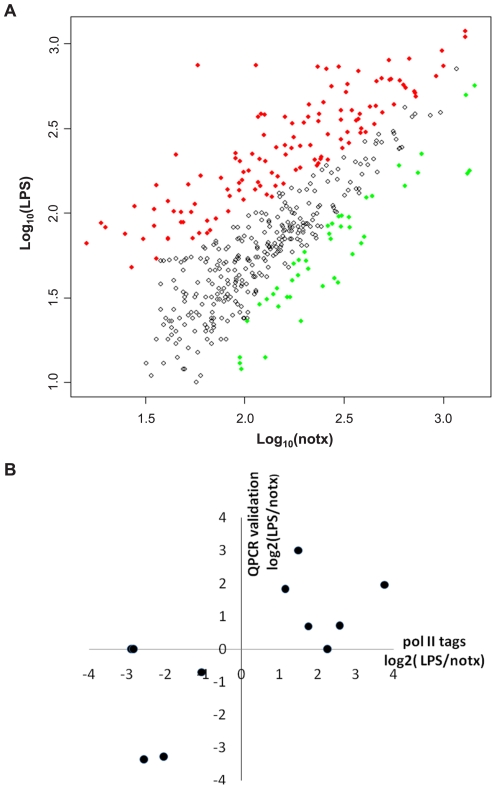
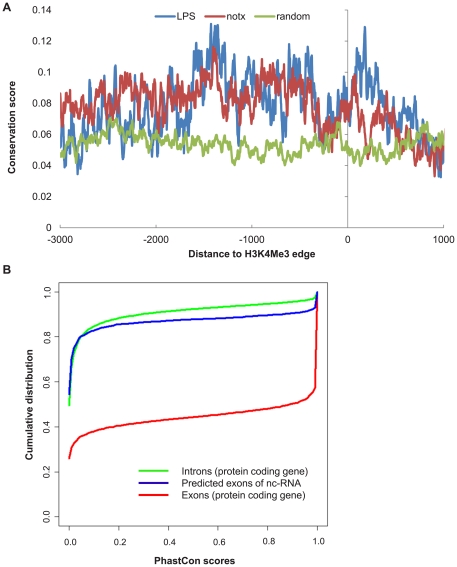
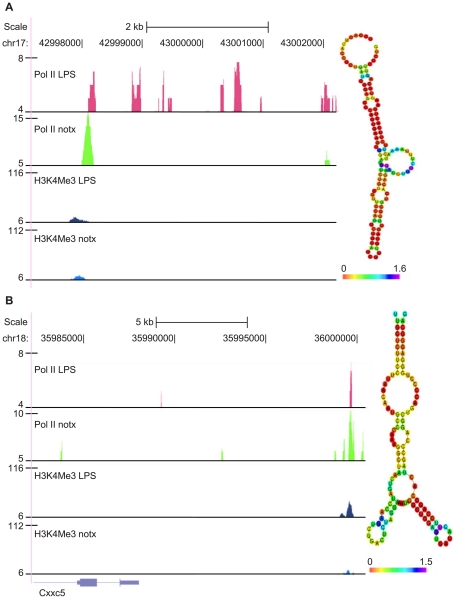
Identification of diffuse signals from the chromatin immunoprecipitation and high-throughput massively parallel sequencing (ChIP-Seq) technology poses significant computational challenges, and there are few methods currently available. We present a novel global clustering approach to enrich diffuse CHIP-Seq signals of RNA polymerase II and histone 3 lysine 4 trimethylation (H3K4Me3) and apply it to identify putative long intergenic non-coding RNAs (lincRNAs) in macrophage cells. Our global clustering method compares favorably to the local clustering method SICER that was also designed to identify diffuse CHIP-Seq signals. The validity of the algorithm is confirmed at several levels. First, 8 out of a total of 11 selected putative lincRNA regions in primary macrophages respond to lipopolysaccharides (LPS) treatment as predicted by our computational method. Second, the genes nearest to lincRNAs are enriched with biological functions related to metabolic processes under resting conditions but with developmental and immune-related functions under LPS treatment. Third, the putative lincRNAs have conserved promoters, modestly conserved exons, and expected secondary structures by prediction. Last, they are enriched with motifs of transcription factors such as PU.1 and AP.1, previously shown to be important lineage determining factors in macrophages, and 83% of them overlap with distal enhancers markers. In summary, GCLS based on RNA polymerase II and H3K4Me3 CHIP-Seq method can effectively detect putative lincRNAs that exhibit expected characteristics, as exemplified by macrophages in the study.
Conflict of interest statement
Figures


Similar articles
-
Spatial clustering for identification of ChIP-enriched regions (SICER) to map regions of histone methylation patterns in embryonic stem cells.Methods Mol Biol. 2014;1150:97-111. doi: 10.1007/978-1-4939-0512-6_5. Methods Mol Biol. 2014. PMID: 24743992 Free PMC article.
-
Genome-wide mapping of histone H3 lysine 4 trimethylation in Eucalyptus grandis developing xylem.BMC Plant Biol. 2015 May 10;15:117. doi: 10.1186/s12870-015-0499-0. BMC Plant Biol. 2015. PMID: 25957781 Free PMC article.
-
Computational identification of human long intergenic non-coding RNAs using a GA-SVM algorithm.Gene. 2014 Jan 1;533(1):94-9. doi: 10.1016/j.gene.2013.09.118. Epub 2013 Oct 9. Gene. 2014. PMID: 24120395
-
Role of ChIP-seq in the discovery of transcription factor binding sites, differential gene regulation mechanism, epigenetic marks and beyond.Cell Cycle. 2014;13(18):2847-52. doi: 10.4161/15384101.2014.949201. Cell Cycle. 2014. PMID: 25486472 Free PMC article. Review.
-
A short survey of computational analysis methods in analysing ChIP-seq data.Hum Genomics. 2011 Jan;5(2):117-23. doi: 10.1186/1479-7364-5-2-117. Hum Genomics. 2011. PMID: 21296745 Free PMC article. Review.
Cited by
-
Pan-Cancer Analyses Reveal Long Intergenic Non-Coding RNAs Relevant to Tumor Diagnosis, Subtyping and Prognosis.EBioMedicine. 2016 May;7:62-72. doi: 10.1016/j.ebiom.2016.03.023. Epub 2016 Mar 19. EBioMedicine. 2016. PMID: 27322459 Free PMC article.
-
Long Non-Coding RNAs Regulating Immunity in Insects.Noncoding RNA. 2017 Mar 16;3(1):14. doi: 10.3390/ncrna3010014. Noncoding RNA. 2017. PMID: 29657286 Free PMC article. Review.
-
Transcription of inflammatory genes: long noncoding RNA and beyond.J Interferon Cytokine Res. 2015 Feb;35(2):79-88. doi: 10.1089/jir.2014.0120. Epub 2014 Sep 24. J Interferon Cytokine Res. 2015. PMID: 25250698 Free PMC article. Review.
-
Long intergenic non-coding RNA expression signature in human breast cancer.Sci Rep. 2016 Nov 29;6:37821. doi: 10.1038/srep37821. Sci Rep. 2016. PMID: 27897201 Free PMC article.
-
Long noncoding RNAs: a potent source of regulation in immunity and disease.Immunol Cell Biol. 2015 Mar;93(3):277-83. doi: 10.1038/icb.2015.2. Immunol Cell Biol. 2015. PMID: 25776990 Review.
References
Publication types
MeSH terms
Substances
Grants and funding
LinkOut - more resources
Full Text Sources
Other Literature Sources
Molecular Biology Databases
