. 2011;6(9):e25204.
doi: 10.1371/journal.pone.0025204. Epub 2011 Sep 29.

Fructose modulates cardiomyocyte excitation-contraction coupling and Ca²⁺ handling in vitro

Affiliations

Fructose modulates cardiomyocyte excitation-contraction coupling and Ca²⁺ handling in vitro

Kimberley M Mellor et al. PLoS One. 2011.

Abstract

Background: High dietary fructose has structural and metabolic cardiac impact, but the potential for fructose to exert direct myocardial action is uncertain. Cardiomyocyte functional responsiveness to fructose, and capacity to transport fructose has not been previously demonstrated.

Objective: The aim of the present study was to seek evidence of fructose-induced modulation of cardiomyocyte excitation-contraction coupling in an acute, in vitro setting.

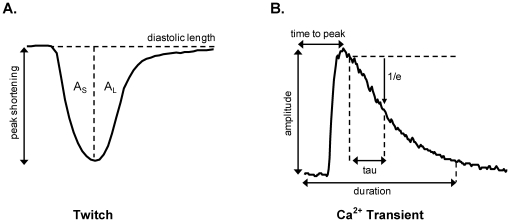
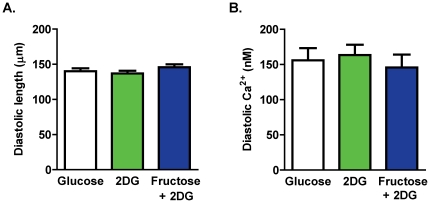
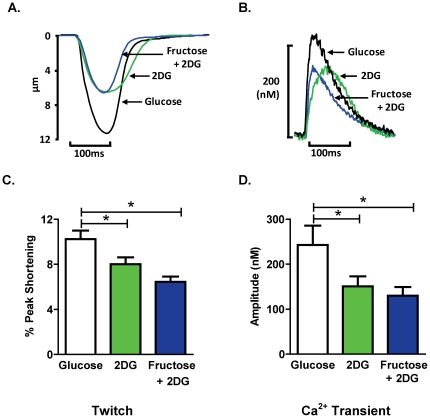
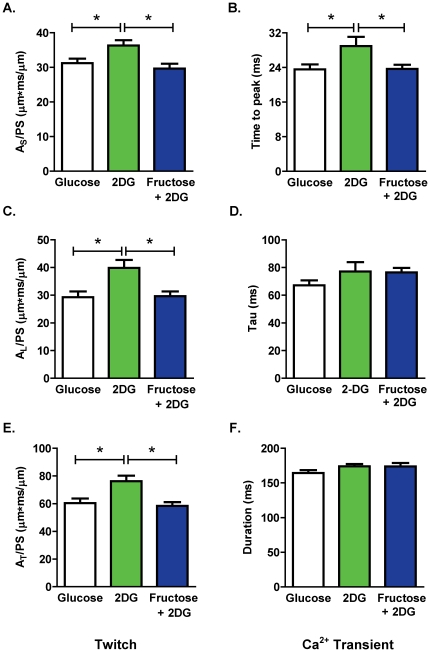
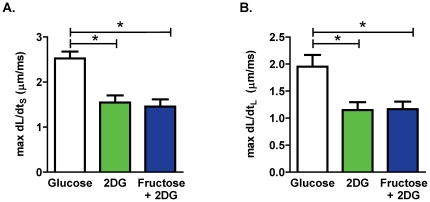
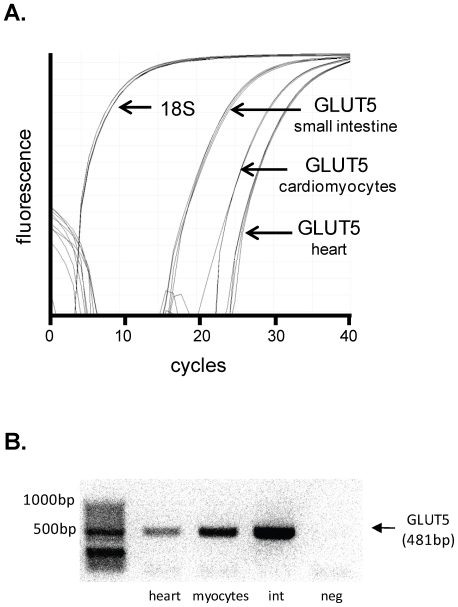
Methods and results: The functional effects of fructose on isolated adult rat cardiomyocyte contractility and Ca²⁺ handling were evaluated under physiological conditions (37°C, 2 mM Ca²⁺, HEPES buffer, 4 Hz stimulation) using video edge detection and microfluorimetry (Fura2) methods. Compared with control glucose (11 mM) superfusate, 2-deoxyglucose (2 DG, 11 mM) substitution prolonged both the contraction and relaxation phases of the twitch (by 16 and 36% respectively, p<0.05) and this effect was completely abrogated with fructose supplementation (11 mM). Similarly, fructose prevented the Ca²⁺ transient delay induced by exposure to 2 DG (time to peak Ca²⁺ transient: 2 DG: 29.0±2.1 ms vs. glucose: 23.6±1.1 ms vs. fructose +2 DG: 23.7±1.0 ms; p<0.05). The presence of the fructose transporter, GLUT5 (Slc2a5) was demonstrated in ventricular cardiomyocytes using real time RT-PCR and this was confirmed by conventional RT-PCR.

Conclusion: This is the first demonstration of an acute influence of fructose on cardiomyocyte excitation-contraction coupling. The findings indicate cardiomyocyte capacity to transport and functionally utilize exogenously supplied fructose. This study provides the impetus for future research directed towards characterizing myocardial fructose metabolism and understanding how long term high fructose intake may contribute to modulating cardiac function.


Conflict of interest statement

Competing Interests: The authors have declared that no competing interests exist.

Figures

Figure 1
Figure 1. Cardiomyocyte excitation-contraction coupling analysis.
A. Parameters used to describe the myocyte twitch cycle were peak shortening (PS, µm), peak shortening normalized to diastolic cell length (%PS), area of the shortening phase (AS, µm*ms), area of the lengthening phase (AL, µm*ms) and area of the total twitch cycle (AT = AS+AL, µm*ms). Area values were determined between baseline and cell length and were normalized to peak shortening amplitude (AS/PS, AL/PS, AT/PS; µm*ms/µm) in order to compare the relative periods of the shortening and relaxation periods in different myocytes. B. Parameters used to describe the Ca2+ transient were amplitude (nM), time to peak (ms), time constant of decay (Tau, ms) fit from 10% below transient peak, and duration (to 90% Ca2+ transient decay, ms). Transient timing parameters (time to peak and duration) were referenced to time of stimulus delivery.
Figure 2
Figure 2. Baseline twitch and Ca2+ transient parameters.
A. Diastolic cell length. B. Diastolic Ca2+ levels. Data presented as mean ± s.e.m. n = 10–28 cells/group.
Figure 3
Figure 3. Effect of acute fructose on twitch and Ca2+ transient profiles.
A. Representative twitch profiles from cardiomyocytes superfused with glucose, 2 DG, or fructose +2 DG solutions. B. Representative Ca2+ transient profiles from cardiomyocytes superfused with glucose, 2 DG, or fructose +2 DG solutions. C. Twitch peak shortening, normalized to diastolic cell length (% PS). D. Ca2+ transient peak amplitude. Data presented as mean ± s.e.m. n = 10–28 cells/group. *p<0.05 (1-way ANOVA, Newman-Keuls post-hoc test).
Figure 4
Figure 4. Effect of acute fructose on cardiomyocyte shortening and Ca2+ handling kinetics.
A. Area of the shortening phase of the twitch cycle normalized to peak shortening (AS/PS) B. Time to peak Ca2+ transient relative to electrical stimulus. C. Area of the lengthening phase of the twitch cycle normalized to peak shortening (AL/PS). D. Time constant of Ca2+ transient decay (Tau). E. Area of the total twitch cycle normalized to peak shortening (AT/PS). F. Duration of the Ca2+ transient (time from stimulus to 90% Ca2+ transient decay). Data presented as mean ± s.e.m. n = 10–28 cells/group. *p<0.05 (1-way ANOVA, Newman-Keuls post-hoc test).
Figure 5
Figure 5. Effect of fructose on cardiomyocyte contractility.
A. Maximum rate of cardiomyocyte shortening (max dL/dtS). B. Maximum rate of cardiomyocyte lengthening (max dL/dtL). Data presented as mean ± s.e.m. n = 10–28 cells/group. *p<0.05 (1-way ANOVA, Newman-Keuls post-hoc test).
Figure 6
Figure 6. Altered myocyte shortening-Ca2+ relationship.
A. Correlation of area of the total twitch cycle normalized to peak shortening (AT/PS) and Ca2+ transient duration for myocytes superfused under control glucose conditions (R2 = 0.416; *p<0.05). B. Correlation of area of the total twitch cycle normalized to peak shortening (AT/PS) and Ca2+ transient duration for myocytes superfused under 2 DG conditions (R2 = 0.028; p = ns). C. Correlation of area of the total twitch cycle normalized to peak shortening (AT/PS) and Ca2+ transient duration for myocytes superfused under fructose +2 DG conditions (R2 = 0.002; p = ns).
Figure 7
Figure 7. GLUT5 gene expression in cardiomyocytes.
A. Real time PCR fluorescence depicting GLUT5 (Slc2a5) gene expression relative to 18S in adult rat isolated cardiomyocytes, heart and small intestine (positive control). B. DNA gel image from conventional RT-PCR of GLUT5 (Slc2a5) in rat heart tissue and isolated cardiomyocytes. GLUT5 primers were designed to obtain a 481 bp PCR product. Small intestine (‘int’) tissue was used as a positive control. Negative control (‘neg’) was obtained by RNA that was not reverse-transcribed to cDNA.

References

    1. Mellor KM, Ritchie RH, Delbridge LM. Reactive oxygen species and insulin-resistant cardiomyopathy. Clin Exp Pharmacol Physiol. 2010;37:222–228. - PubMed
    1. Mellor KM, Ritchie RH, Davidoff AJ, Delbridge LMD. Elevated dietary sugar and the heart: experimental models and myocardial remodeling. Can J Physiol Pharmacol. 2010;88:525–540. - PubMed
    1. Chess DJ, Xu W, Khairallah R, O'Shea KM, Kop WJ, et al. The antioxidant tempol attenuates pressure overload-induced cardiac hypertrophy and contractile dysfunction in mice fed a high fructose diet. Am J Physiol Heart Circ Physiol. 2008;295:H2223–2230. - PMC - PubMed
    1. Henry RR, Crapo PA, Thorburn AW. Current issues in fructose metabolism. Annu Rev Nutr. 1991;11:21–39. - PubMed
    1. Tappy L, Le KA. Metabolic effects of fructose and the worldwide increase in obesity. Physiol Rev. 2010;90:23–46. - PubMed

Publication types