. 2011;6(9):e25461.
doi: 10.1371/journal.pone.0025461. Epub 2011 Sep 28.

Control of vocal and respiratory patterns in birdsong: dissection of forebrain and brainstem mechanisms using temperature

Affiliations

Control of vocal and respiratory patterns in birdsong: dissection of forebrain and brainstem mechanisms using temperature

Aaron S Andalman et al. PLoS One. 2011.

Abstract

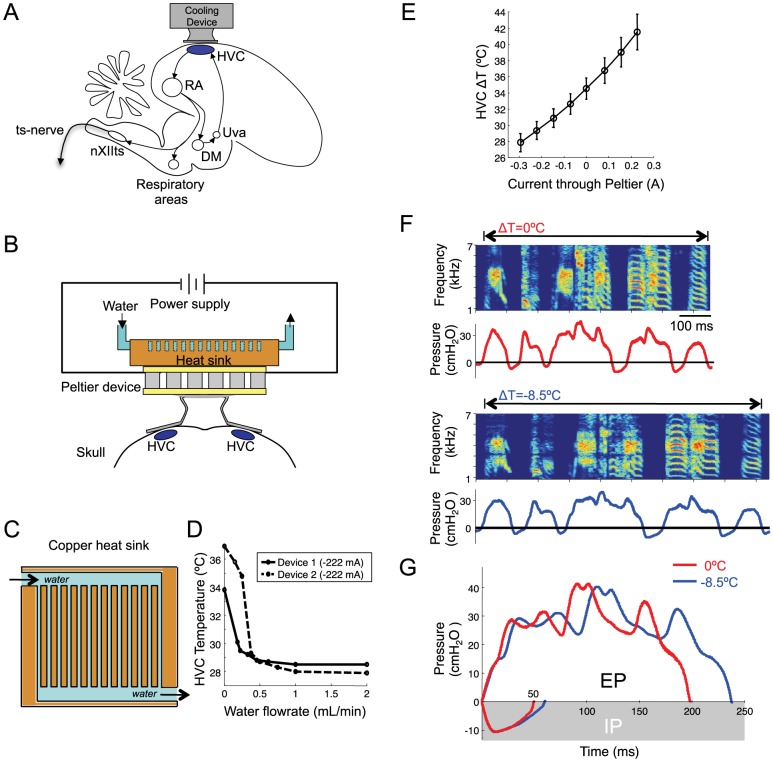
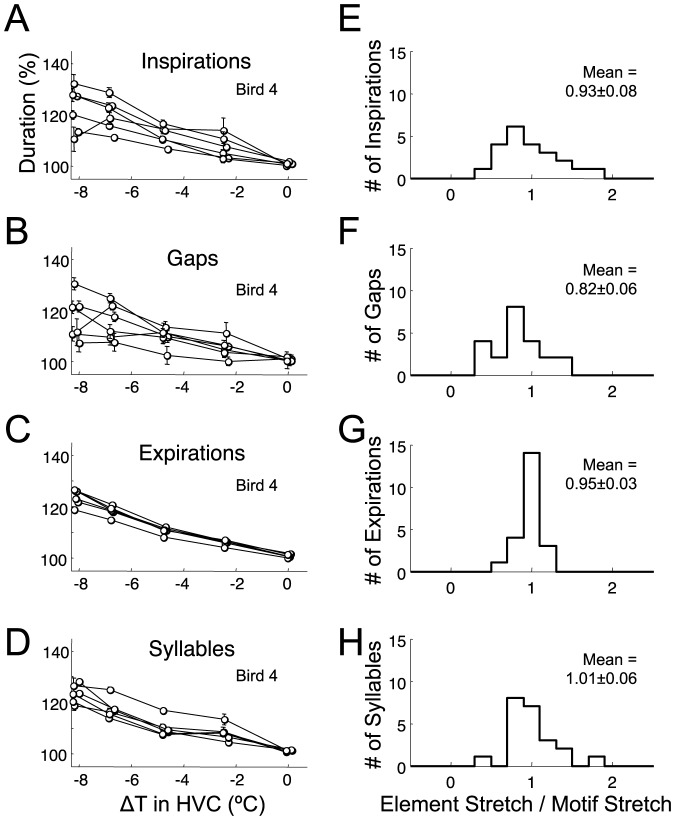
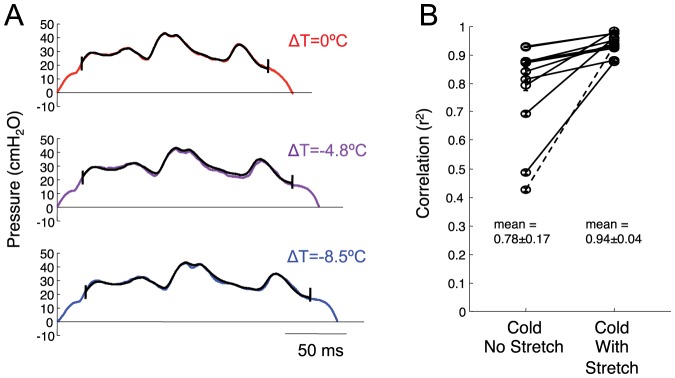
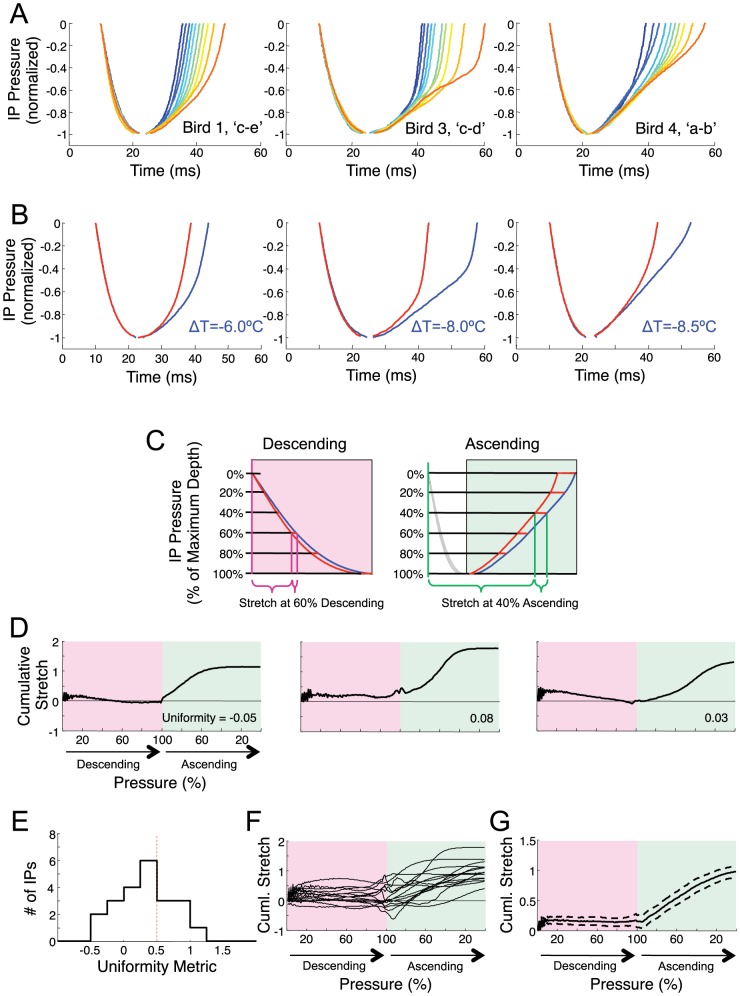
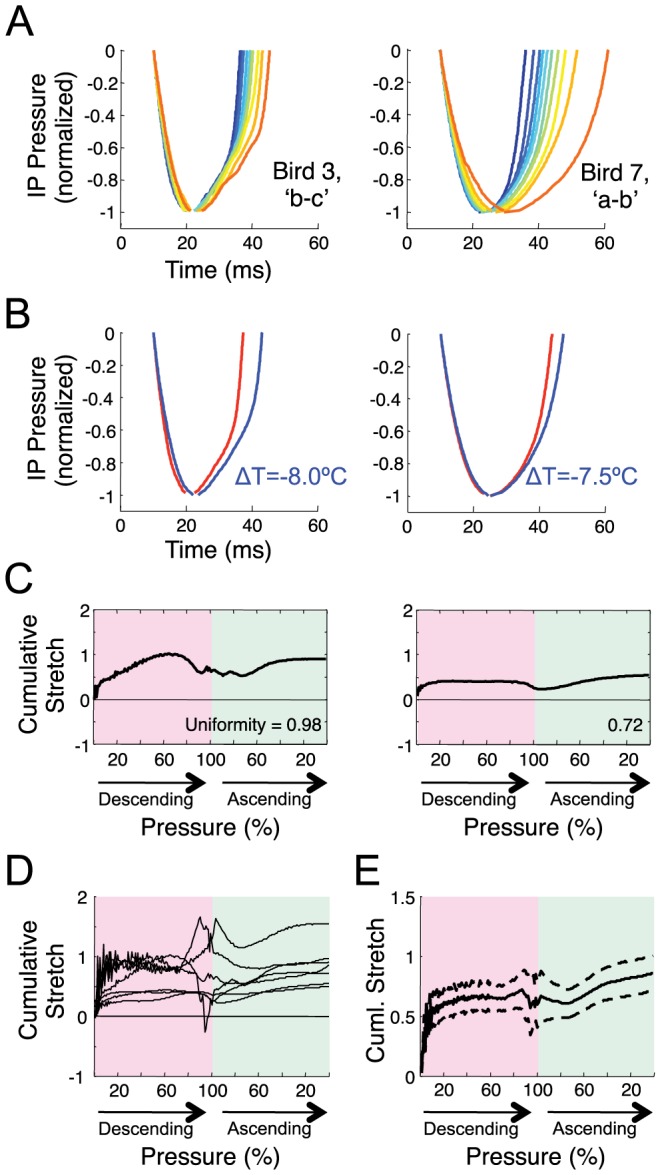
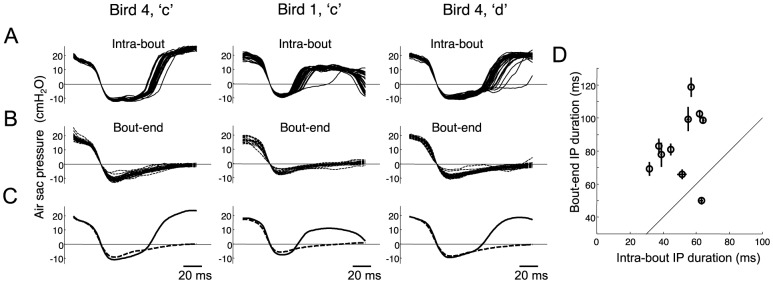
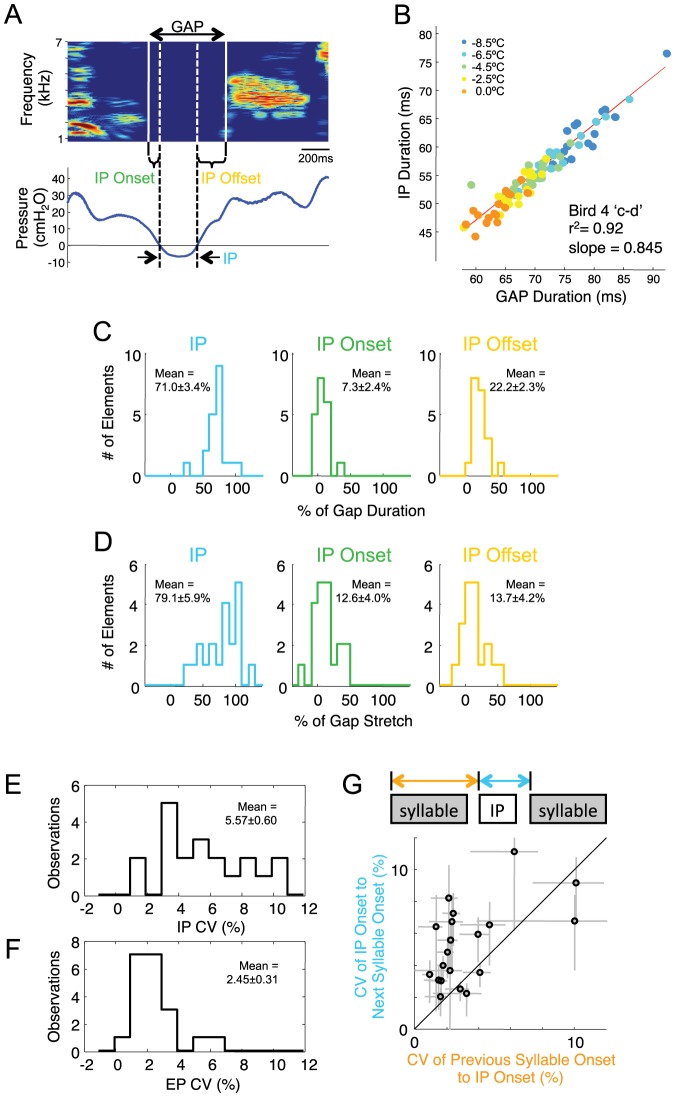
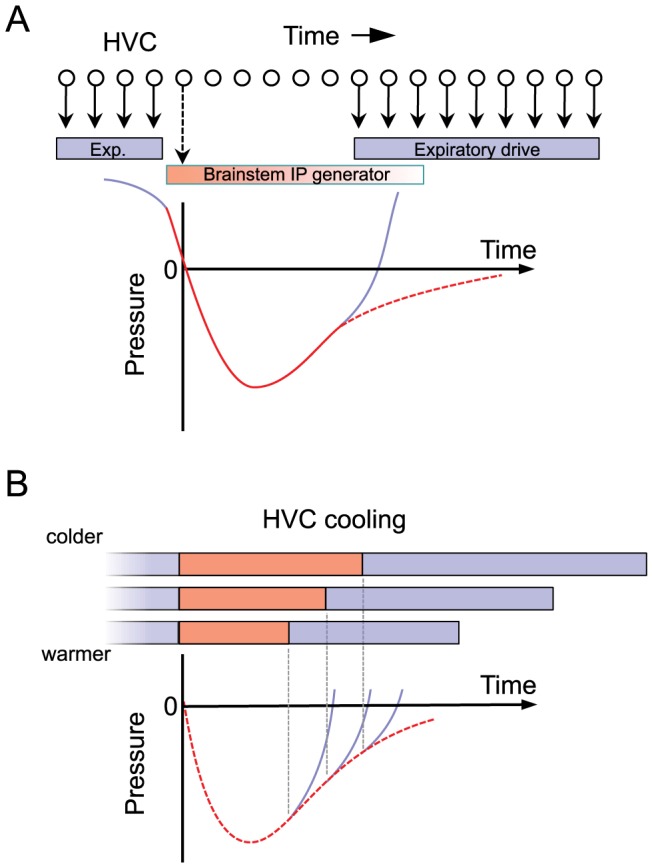
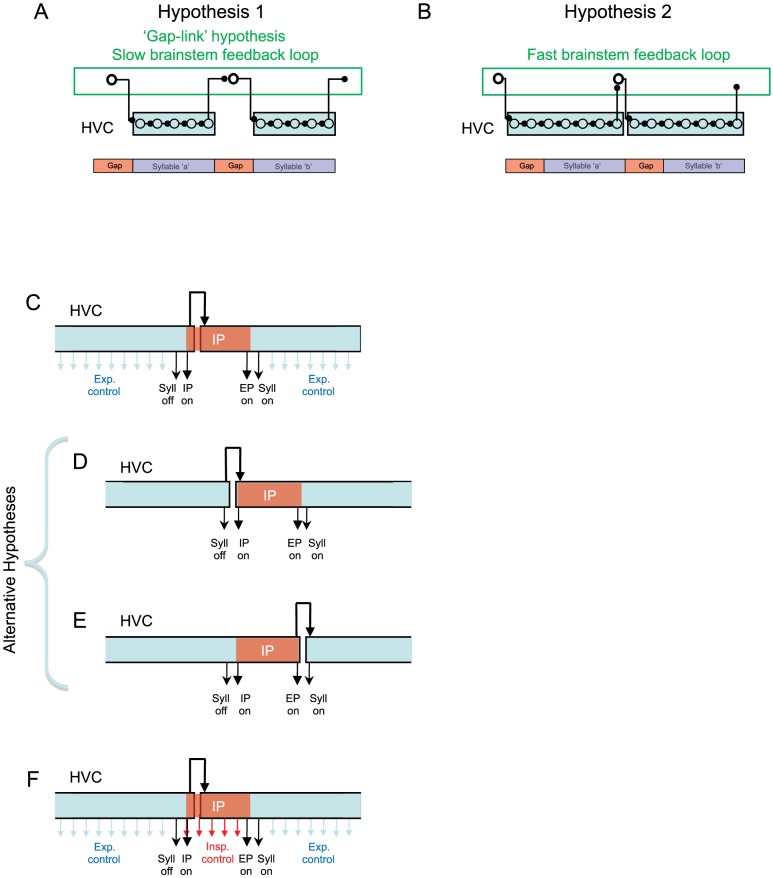
Learned motor behaviors require descending forebrain control to be coordinated with midbrain and brainstem motor systems. In songbirds, such as the zebra finch, regular breathing is controlled by brainstem centers, but when the adult songbird begins to sing, its breathing becomes tightly coordinated with forebrain-controlled vocalizations. The periods of silence (gaps) between song syllables are typically filled with brief breaths, allowing the bird to sing uninterrupted for many seconds. While substantial progress has been made in identifying the brain areas and pathways involved in vocal and respiratory control, it is not understood how respiratory and vocal control is coordinated by forebrain motor circuits. Here we combine a recently developed technique for localized brain cooling, together with recordings of thoracic air sac pressure, to examine the role of cortical premotor nucleus HVC (proper name) in respiratory-vocal coordination. We found that HVC cooling, in addition to slowing all song timescales as previously reported, also increased the duration of expiratory pulses (EPs) and inspiratory pulses (IPs). Expiratory pulses, like song syllables, were stretched uniformly by HVC cooling, but most inspiratory pulses exhibited non-uniform stretch of pressure waveform such that the majority of stretch occurred late in the IP. Indeed, some IPs appeared to change duration by the earlier or later truncation of an underlying inspiratory event. These findings are consistent with the idea that during singing the temporal structure of EPs is under the direct control of forebrain circuits, whereas that of IPs can be strongly influenced by circuits downstream of HVC, likely in the brainstem. An analysis of the temporal jitter of respiratory and vocal structure suggests that IPs may be initiated by HVC at the end of each syllable and terminated by HVC immediately before the onset of the next syllable.


Conflict of interest statement

Competing Interests: The authors have declared that no competing interests exist.

Figures

Figure 1
Figure 1. Respiratory patterns are slowed by HVC cooling.
A) Sagittal schematic of the song motor pathway showing the Peltier device used for localized cooling of HVC. DM, dorsomedial nucleus of the intercollicular complex; nXIIts, tracheosyringeal part of the hypoglossal nucleus; RA, robust nucleus of the arcopallium; ts-nerve, tracheosyringeal nerve; Uva, nucleus Uvaeformis. B) Frontal-view schematic of the cooling device placed bilaterally over HVC. Water flows through a copper heat sink to efficiently dissipate heat pumped from the brain by a Peltier device. Grey blocks are alternating n- and p-doped semiconductor elements. C) Illustration of interior design of the heat sink. D) Calibration of the heat sink as a function of water flow rate was measured for the two constructed devices. A constant current was used to drive the Peltier device, and the temperature in HVC was measured at various rates of water flow through the heat sink. E) Average temperature changes in HVC as a function of current through the Peltier device (n = 6 calibration birds and 2 devices; error bars indicate standard deviation). F) Song spectrogram and thoracic air sac pressure (Bird 4) at normal HVC temperature (top) and with HVC cooled by 8.5°C (bottom). G) A single trace of an expiratory pressure pulse (EP, above) from syllable ‘c’ and an inspiratory pressure pulse (IP, below) from gap ‘c–d’, at normal and cooled HVC temperature (red and blue traces, respectively).
Figure 2
Figure 2. Respiratory and vocal events are lengthened equally by HVC cooling.
A–D) Average duration of all IPs, gaps, EPs, and syllables in Bird 4 at different HVC temperatures as a percentage of their average duration at the control temperature (a slight horizontal jitter was added to all data points to prevent overlap of error bars; error bars in all figures indicate s.e.m. except where otherwise noted). E–H) Histogram of temperature-dependent stretch of all IPs (n = 22), gaps (n = 22), EPs (n = 22), and syllables (n = 22), normalized by the overall stretch of the song motif (n = 5 birds).
Figure 3
Figure 3. EPs are stretched uniformly by HVC cooling.
A) Example renditions of an EP (Bird 4, syllable ‘c’) recorded at three different HVC temperatures (red is control, blue is coldest. The template waveform (black) is the average EP pressure waveform at the control temperature. To assess the uniformity of EP stretch, the template EP is linearly stretched to be the same length as each EP rendition and then temporally shifted to maximize its correlation with that EP. The first and last 10% percent of template and EP are excluded from the analysis. B) Average goodness-of-fit (correlation coefficient) of the template with EP renditions from the cold HVC condition with no stretch of the template (left, n = 11 identified EPs). Average goodness-of-fit when the template EP was uniformly stretched to be same length as each EP rendition before fitting (right, dashed line corresponds to the EP shown in panel A).
Figure 4
Figure 4. Most IPs are stretched nonuniformly by HVC cooling.
A) Examples of IP waveforms of different duration from three identified gaps (Bird 1 ‘c–e’; Bird 3 ‘c–d’; Bird 4 ‘a–b’). Each trace is an average of a minimum of 10 individual IPs grouped by duration (see Methods). Different traces represent IPs sorted from shortest (blue) to longest (red), in different percentiles of the distribution of IP durations. B) Average IP waveforms recorded at control temperature (red) and at maximal HVC cooling (blue), for the IPs shown in part A. C) Illustration of how cumulative stretch is computed: the time it takes the IP to reach a certain percentage of its maximum depth (from IP onset) is measured at each temperature condition, and the temperature-dependence of this time-to-threshold is calculated. This process is repeated for all percentages on both the descending and ascending phase of the IP, and these values are normalized by the bird's motif stretch to produce a ‘cumulative stretch’ curve. Note that, for perfectly uniform stretch, the cumulative stretch curve would be constant at all points on the IP, and would be a flat line. D) The cumulative stretch curve for each IP shown in part A. These IPs exhibited a highly non-uniform stretch, with little temperature dependence during the descending phase of the IP. E) Histogram of a uniformity metric for all IPs, given by the ratio of the temperature-dependent stretch of the descending phase of the IP (measured just before the pressure minimum), to the total stretch of the IP. F) Cumulative stretch curve for each IP with a uniformity metric less than 0.5. G) Mean and standard deviation of the cumulative stretch curves in panel F.
Figure 5
Figure 5. Some IPs are stretched uniformly by HVC cooling.
A) Examples of IPs that show uniform stretch (Bird 3 ‘b–c’; Bird 7 ‘a–b’). Each trace is an average of a minimum of 10 individual IPs grouped by duration (see Methods) from shortest (blue) to longest (red). B) Average IP waveforms recorded at control temperature (red) and maximal HVC cooling (blue) for the IPs shown in part A. C) The cumulative stretch curve of the IPs shown in part A. These IPs exhibited a near uniform stretch throughout descending and ascending phases. D) Cumulative stretch curves for all IPs with a uniformity greater than 0.5. E) Mean and standard deviation of these cumulative stretch curves.
Figure 6
Figure 6. IPs are longer at bout offset.
A) Examples of identified IPs produced within a song bout, where there was a following syllable. B) Examples of the same IPs produced at bout-end, where there was no following syllable. C) Average of the intra-bout IPs (solid) and bout-end IPs (dashed). D) Scatter plot of duration of IPs following bout-ending syllable renditions versus intra-bout syllable renditions for the 10 syllables that occurred at bout-ends with sufficient frequency to be analyzed.
Figure 7
Figure 7. Analysis of respiratory-vocal coordination: HVC cooling and natural variability.
A) Song spectrogram of two syllables showing the silent gap between them, and a simultaneous recording of thoracic air sac pressure. Three distinct components of the gap are identified: the IP onset period (between the end of the syllable and the start of the IP), the IP itself, and the IP offset period (between the offset of the IP and the onset of the syllable). B) Scatter plot of IP duration versus gap duration for 100 renditions of one gap (Bird 4 ‘c–d’) over all temperature conditions (orange, warm; blue, cold). C) Histograms of the fraction of the gap occupied by the three gap components (IP, left; IP onset period, middle; IP offset period, right). Each identified gap (e.g. ‘a–b’, ‘b–c’) is analyzed separately (n = 20 gaps, from directed song only). D) Individual contribution of IP, IP onset period, and IP offset period to the overall temperature-dependent stretch of gaps for all syllable transitions. E) Coefficient of variation (CV) of IP durations (n = 20 identified gaps) and F) CV of EP durations (n = 20 syllables, directed song only). IPs show significantly higher fractional variability than EPs (CV of IPs, 5.57±0.60%; CV of EPs, 2.45±0.31%, p<0.001). G) Scatter plot comparing, for each IP, the CV of the interval from IP onset to both the proceding and the following syllable onset (n = 20 gaps, directed song only).
Figure 8
Figure 8. Sparse HVC sequences and a hypothesis for their control of respiratory patterns.
A) HVC neurons generate a sparse sequence of activity. Each neuron is active only once per song rendition, and it has been suggested that a sub-population of these neurons is active at each moment in the song , . Here we propose that some IPs are generated by a mechanism in which HVC initiates and terminates IPs (I/T model). In this model, HVC ‘triggers’ downstream circuitry (perhaps in the brainstem) that controls the activation and time course of inspiratory pulses. Early in the IP, HVC exerts little control on the time course the pressure waveform. At the end of the IP, HVC again takes over control of respiratory circuitry to generate the EP for the next syllable. B) This model predicts the non-uniform stretch of most IPs observed in our experiments. Slowing of the HVC chain by cooling HVC increases the interval between IP initiation and termination, thus increasing the IP duration without changing the shape of the early part of the IP. Thus, the temperature-dependent stretch of the IP waveform occurs only in the later parts of the IP. Changes in the IP waveform can be described as the earlier or later truncation of an underlying IP waveform.
Figure 9
Figure 9. Linked-chain model of HVC and a hypothesis for its interaction with the IP generator.
HVC may contain modules (light blue rectangles) of synaptically connected chains of neurons that activate each other sequentially. It has been hypothesized that each chain may code for a syllable or part thereof, and that these chains may activate each other sequentially via a bilateral brainstem feedback loop . However, this sequential activation could relate to syllables and gaps in a number of ways. A) One possibility is that syllables are generated by HVC chains while gaps are produced during slow feedback through the brainstem loop (‘gap-link’ hypothesis). B) Another hypothesis in which gaps and syllables are both generated by HVC chains, and each chain is activated at the end of the previous chain by fast feedback through the brainstem loop. We argue that the model in panel A is not supported by existing data. C–E) Three different hypotheses for how IPs could be coordinated with the transition between syllable chains in HVC. C) The end of the first chain could terminate the syllable and initiate an IP. After control is transferred to the next chain by the fast feedback loop, the second chain terminates the IP and initiates the next syllable. D) An alternative hypothesis in which the first chain terminates the syllable and the second chain initiates the IP, terminates the IP and then initiates the next syllable. E) Another alternative hypothesis in which the syllable termination, IP initiation and termination are all controlled by the first chain. Previous electrophysiological studies, as well as an analysis of variability in song and respiratory timing, support the model in panel C. E) In some cases, HVC may maintain continuous direct influence the pressure waveform during the IP, thus accounting for the uniform stretch of some IPs with HVC cooling.

Similar articles

Cited by

References

    1. Northcutt RG. Understanding Vertebrate Brain Evolution. Integ and Comp Biol. 2002;42:743–756. - PubMed
    1. Grillner S, Hellgren J, Menard A, Saitoh K, Wikstrom MA. Mechanisms for selection of basic motor programs–roles for the striatum and pallidum. Trends Neurosci. 2005;28:364–370. - PubMed
    1. Moody SL, Zipser D. A model of reaching dynamics in primary motor cortex. J Cognitive Neurosci. 1998;10:35–45. - PubMed
    1. Schwartz AB, Moran DW. Arm trajectory and representation of movement processing in motor cortical activity. Eur J Neurosci. 2000;12:1851–1856. - PubMed
    1. Levelt WJM. Speaking: from intention to articulation: MIT Press 1993

Publication types