. 2011;6(9):e25531.
doi: 10.1371/journal.pone.0025531. Epub 2011 Sep 30.

Practical tools to implement massive parallel pyrosequencing of PCR products in next generation molecular diagnostics

Affiliations

Practical tools to implement massive parallel pyrosequencing of PCR products in next generation molecular diagnostics

Kim De Leeneer et al. PLoS One. 2011.

Abstract

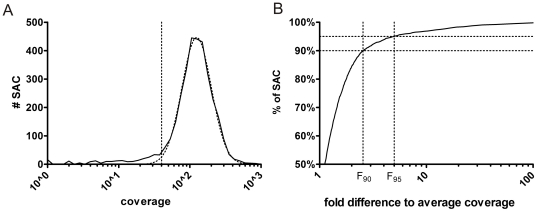
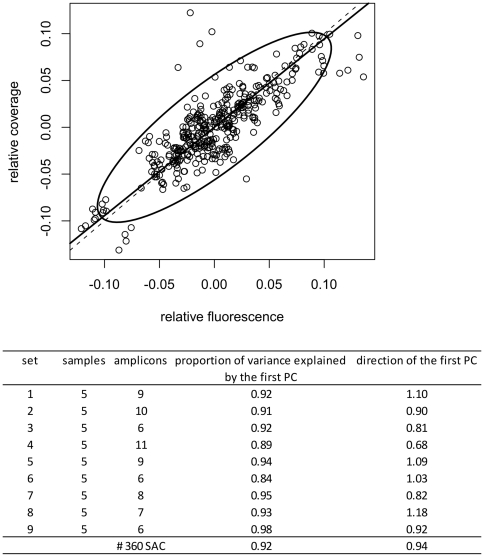
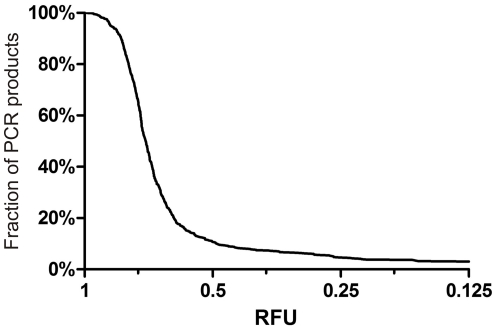
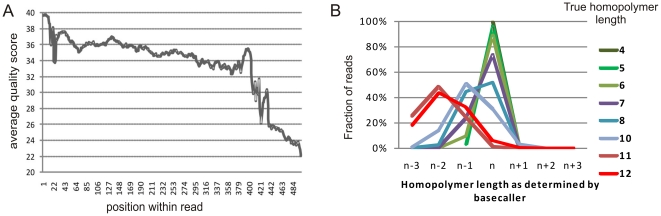
Despite improvements in terms of sequence quality and price per basepair, Sanger sequencing remains restricted to screening of individual disease genes. The development of massively parallel sequencing (MPS) technologies heralded an era in which molecular diagnostics for multigenic disorders becomes reality. Here, we outline different PCR amplification based strategies for the screening of a multitude of genes in a patient cohort. We performed a thorough evaluation in terms of set-up, coverage and sequencing variants on the data of 10 GS-FLX experiments (over 200 patients). Crucially, we determined the actual coverage that is required for reliable diagnostic results using MPS, and provide a tool to calculate the number of patients that can be screened in a single run. Finally, we provide an overview of factors contributing to false negative or false positive mutation calls and suggest ways to maximize sensitivity and specificity, both important in a routine setting. By describing practical strategies for screening of multigenic disorders in a multitude of samples and providing answers to questions about minimum required coverage, the number of patients that can be screened in a single run and the factors that may affect sensitivity and specificity we hope to facilitate the implementation of MPS technology in molecular diagnostics.


Conflict of interest statement

Competing Interests: The authors have declared that no competing interests exist.

Figures

Figure 1
Figure 1. Coverage analysis.
A) Distribution plot of the coverage observed in a pilot study representative for NGMD screening (full line) with 3300 sample amplicon combinations (SAC), derived from sequencing 30 patients for FBN1, TGFBR1 and TGFBR2. The coverage across different SAC appears to be log normally distributed (R2 with best Gaussian fit (dashed line)>0.99). At low coverage (<40, vertical line), the distribution deviates from its Gaussian fit. This reflects a low number of reactions that failed to give a normal coverage. Analysis of these SAC may provide clues on how to further optimize the screening. B) Cumulative distribution plot of the relative coverage (expressed as a fold difference of each SAC to the average coverage). This plot allows determination of the correction factor by looking up the relative coverage for which the curve passes a given threshold, e.g. 90% for the calculation of F90.
Figure 2
Figure 2. emulsion PCR and sequencing bias.
Nine different fluorescently labeled multiplex PCRs (6 to 11-plexes), amplified on 5 different samples, were analyzed on a capillary sequencer to determine relative amplicon abundances prior to emulsion PCR and sequencing on a GS-FLX. Relative fluorescent signals were compared to their corresponding coverage values. The top panel shows the relative coverage in function of the relative fluorescence for the 360 SACs. The ellipse represents the 95% confidence region according to the multivariate normal distribution. The continuous line is the first principal component (PC) which indicates the direction of the largest variance in the sample: 92% of the variance of the sample can be explained by the first PC. The first PC lays very close to the first bisectrice (dashed line). Hence, there is a good 1∶1 relationship between the relative fluorescence and the relative coverage, indicating that a certain increase in relative fluorescence on average induces an equal increase in relative coverage. The table at the bottom summarizes results across all 9 multiplex PCRs (360 SACs). It shows that the first PC explains a large proportion of the variance of each multiplex (84%–98%): the majority of variation in coverage results from variations in input amounts (as determined by fragment analysis on a capillary sequencer).
Figure 3
Figure 3. Analysis of amplicon abundance.
This graph represents the distribution of the relative end point fluorescence intensities (RFU, relative to the maximum fluorescence), across 627 different qPCR reactions on a single sample. About 90% of reactions have RFU values of at least 0.5. This implies that if equal volumes of all PCR reactions are pooled, the concentration of 90% of amplicons will vary less than 2-fold. This fraction of amplicons can be increased to 96% by using a double volume for the PCRs in the 0.5–0.25 RFU range, and to 97% by using a quadruple volume for the PCRs in the 0.25–0.125 RFU range. The concentration of the remaining 3% of PCR reactions is too low to be efficiently used.
Figure 4
Figure 4. GS-FLX sequence quality analysis.
a) Average quality score in function of the position within the reads for a representative dataset (full Titanium run with amplicons for breast cancer and for familial aorta aneurysmata screenings). Across the first 400 bp there is an average quality of 35.3 corresponding to a predicted error rate of 0.029%. b) Comparison of the observed homopolymer length in a series of sequencing runs to the expected length based on the reference sequence. Results are plotted as the fraction of reads having correct homopolymer length estimation (n), an underestimation of the homopolymer length (n−1, n−2, n−3) or an overestimation (n+1, n+2, n+3). The vast majority of reads for homopolymers of up to 6 repeats has correct length estimation, less than 2% are overcalls and less than 10% are undercalls. For homopolymers of 7 repeats, three quarters of the reads are correctly called and over 20% of the reads are interpreted to be missing one repeat. Only by filtering for low allele frequencies can these repeats be analyzed. At 8 repeats only about half of the reads are correctly called, at even larger homopolymer lengths only a minority of reads have a correct basecalling.

References

    1. Chou LS, Lyon E, Wittwer CT. A comparison of high-resolution melting analysis with denaturing high-performance liquid chromatography for mutation scanning: cystic fibrosis transmembrane conductance regulator gene as a model. American journal of clinical pathology. 2005;124:330–338. - PubMed
    1. De Leeneer K, Coene I, Poppe B, De Paepe A, Claes K. Genotyping of frequent BRCA1/2 SNPs with unlabeled probes: a supplement to HRMCA mutation scanning, allowing the strong reduction of sequencing burden. The Journal of molecular diagnostics: JMD. 2009;11:415–419. - PMC - PubMed
    1. Wittwer CT. High-resolution DNA melting analysis: advancements and limitations. Human mutation. 2009;30:857–859. - PubMed
    1. De Leeneer K, Coene I, Poppe B, De Paepe A, Claes K. Rapid and sensitive detection of BRCA1/2 mutations in a diagnostic setting: comparison of two high-resolution melting platforms. Clinical chemistry. 2008;54:982–989. - PubMed
    1. Sanger F, Coulson AR. A rapid method for determining sequences in DNA by primed synthesis with DNA polymerase. Journal of molecular biology. 1975;94:441–448. - PubMed

Publication types

MeSH terms